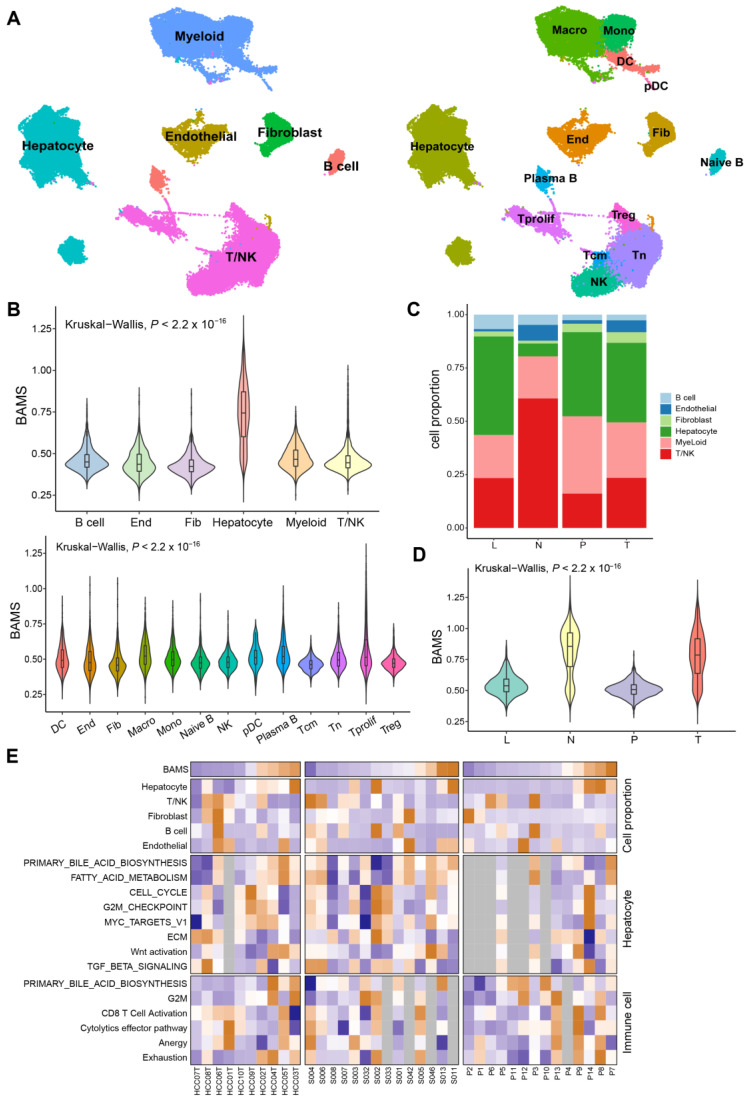
Figure 5.
Single-cell RNA sequencing (scRNA-seq) analysis of HCC patients regarding BAMS in GSE149614. (A) The uniform manifold approximation and projection (UMAP) plot of major cell types (left) and subclusters (right). Macro: Macrophage; Mono: Monocyte; DC: Dendritic cell; pDC: Plasma dendritic cell; End: Endothelial cell; Fib: Fibroblast; T prolif: Proliferation T cell; Tcm: Central memory T cell; and Tn: Naïve T cell. (B) Violin plot of BAMS in major cell types (top) and subclusters except for hepatocytes (bottom). The statistical difference was compared via the Kruskal–Wallis test. (C) Stacked bar plots showing the percentages of major cell types in each tissue type. L: MLN metastatic lymph node; N: non-tumor liver; P: portal vein tumor thrombus; T: primary tumor. (D) Violin plot described the BAMS of hepatocytes in each tissue. (E) Clustered heatmap of related signatures across three datasets (GSE149614, GSE151530, and GSE156625). The samples are ordered by BAMS from the lowest to the highest from the color blue to orange, respectively. Grey rectangles indicate that the number of cells in the sample is less than 50.

