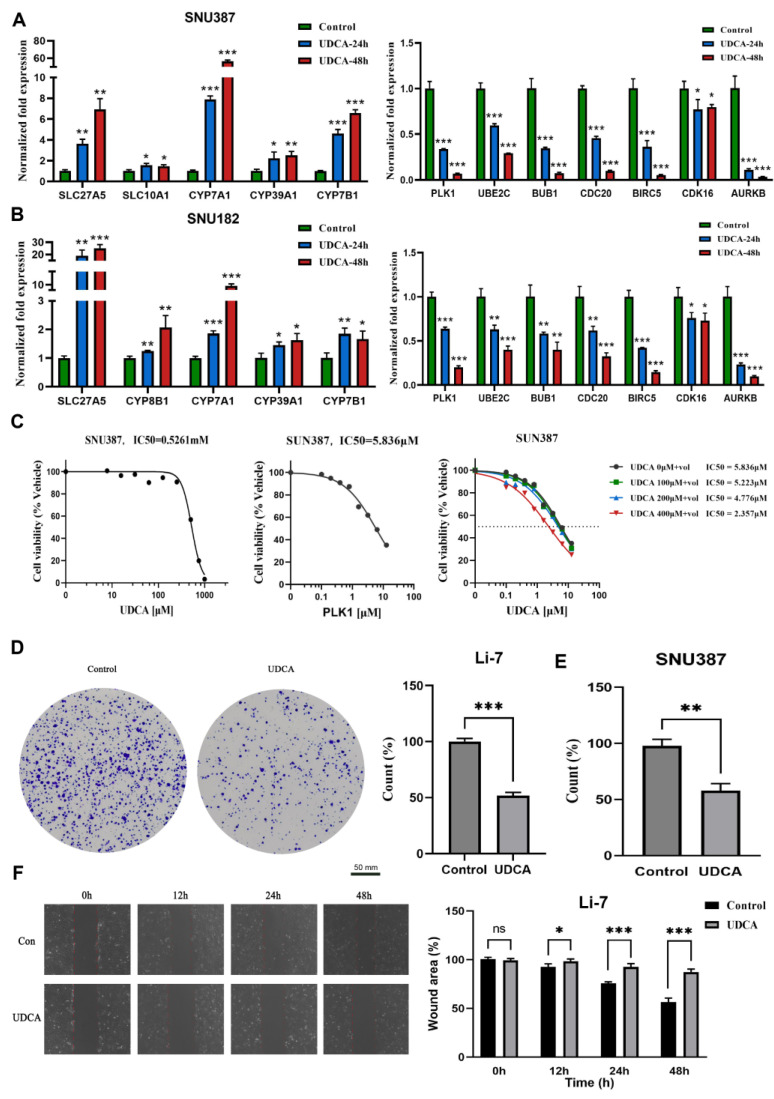
Figure 6.
UDCA suppresses cell viability and migration in HCC cells. Relative cell cycle-related genes and BA metabolism-related gene levels using UDCA were analyzed via qPCR in SNU387 (A) and SNU182 (B). (C) Cell growth curve indicates the IC50 of UDCA (left), IC50 of volasertib (middle), and increasing concentrations of UDCA in a combination from 0 to 400 μM (right) in SNU387; “+vol” means add Volasertib, dashed line is IC50. Images of colony formation assays in Li-7 (D) and SNU387 (E). (F) Images of the wound-healing assay in 0, 12, 24, and 48 h (left), and counts of migrated tumor cells shown on the (right), Li-7, the scale bar was same as (D). Results are means ± SD of three independent experiments. (ns, not significant, * p < 0.05, ** p < 0.01, *** p < 0.001).

