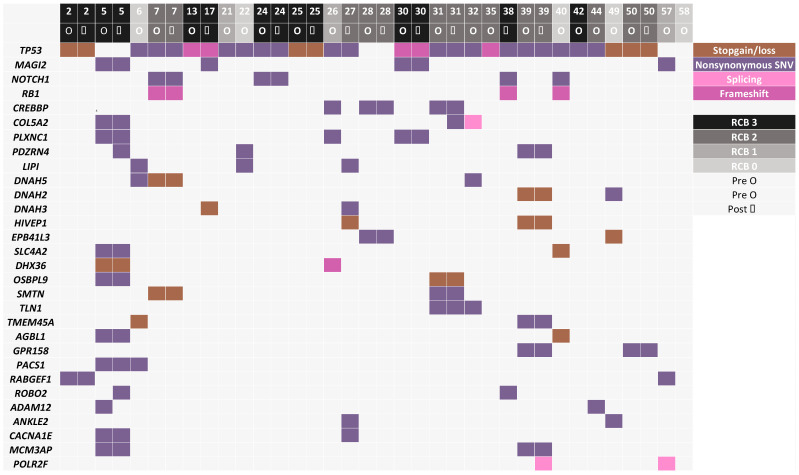
Figure 2.
Top 30 mutated genes in tumors from at least 2 patients in pre- and post-chemotherapy tumors (when available). Each column represents one tumor sample, and each color represents different types of alterations. When genes were mutated in only 2 patients, variants with the highest CADD score were selected. RCB score is depicted in grey scale on top of each column.

