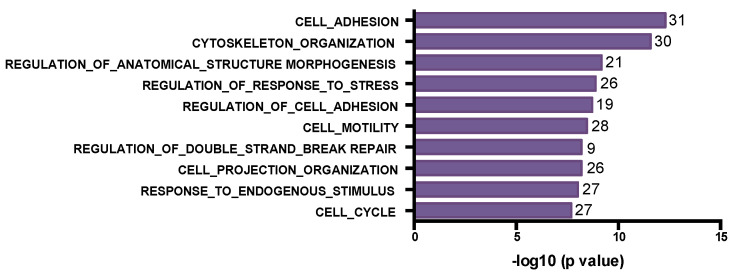
Figure 6.
Bar plot for Gene Ontology biological process terms enrichment based on GSEA analysis using the MsigDB [23,24]. The top 10 significant terms with FDR < 0.05 are depicted for mutated genes depleted in post-treatment tumor samples. The number of genes in each term are indicated at the end of each bar.

