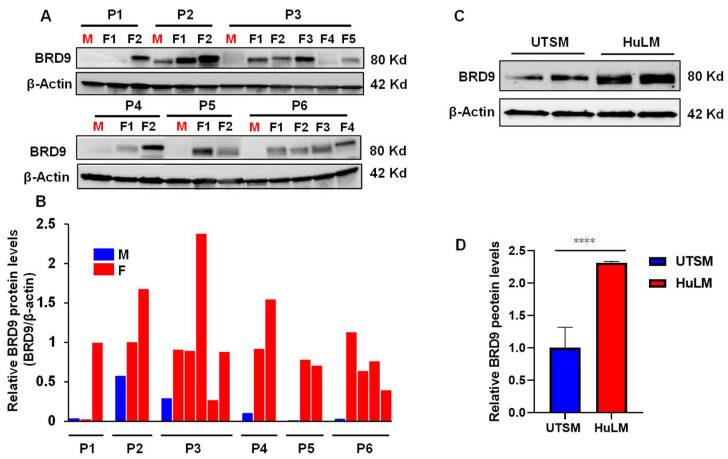
Figure 1.
Protein levels of BRD9 in human UF tissues and cells. (A) Immunoblot analysis was performed to determine the levels of BRD9 protein in UFs (n = 17) and myometrium tissues (n = 6). (B) The protein levels of BRD9 in UFs and myometrium in (A) were quantified using NIH Image J software (1.53t version) (NIH, Bethesda, MD, USA) and presented as fold changes (F/M). (C) Immunoblot analysis was performed to determine the levels of BRD9 protein in HuLM and UTSM cells. (D) The BRD9 levels in HuLM and UTSM cells in (C) were quantified using NIH Image J software and presented as fold changes (HuLM/UTSM). β-actin was used as an endogenous control. P: patients, M: myometrium; F: uterine fibroids, **** p < 0.0001.

