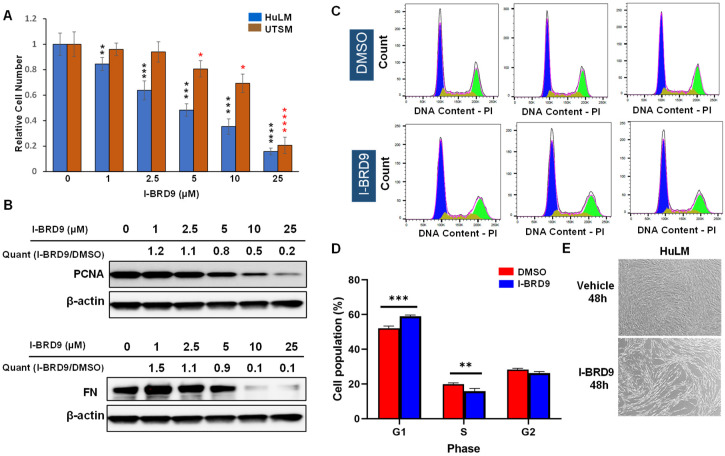
Figure 2.
Treatments with I-BRD9 decrease UF cell proliferation and ECM levels. (A) HuLM and UTSM cell proliferation was performed in the presence or absence of I-BRD9 with a trypan blue exclusion assay. (B) The protein levels of PCNA and fibronectin (FN) were examined via Immunoblot analysis using anti-PCNA and anti-FN antibodies, respectively. Quantification of immunoblot signals was performed after normalization to β-actin. (C) Flow cytometry analysis was performed to measure the cell cycle phase distribution (blue color: G1; yellow color: S; green color: G2) in HuLM cells treated with I-BRD9 (n = 3 for each group). (D) Quantitative analysis of cell cycle data. (E) Morphological changes to HuLM cells after treatment with I-BRD9. Magnification was applied ×10. Pictures were taken by EVOS XL Core imaging system (Invitrogen) * p < 0.05, ** p < 0.01; *** p < 0.001; **** p < 0.0001. * Comparison between DMSO- and I-BRD9 treated HuLM cells, * comparison between DMSO- and I-BRD9 treated UTSM cells.

