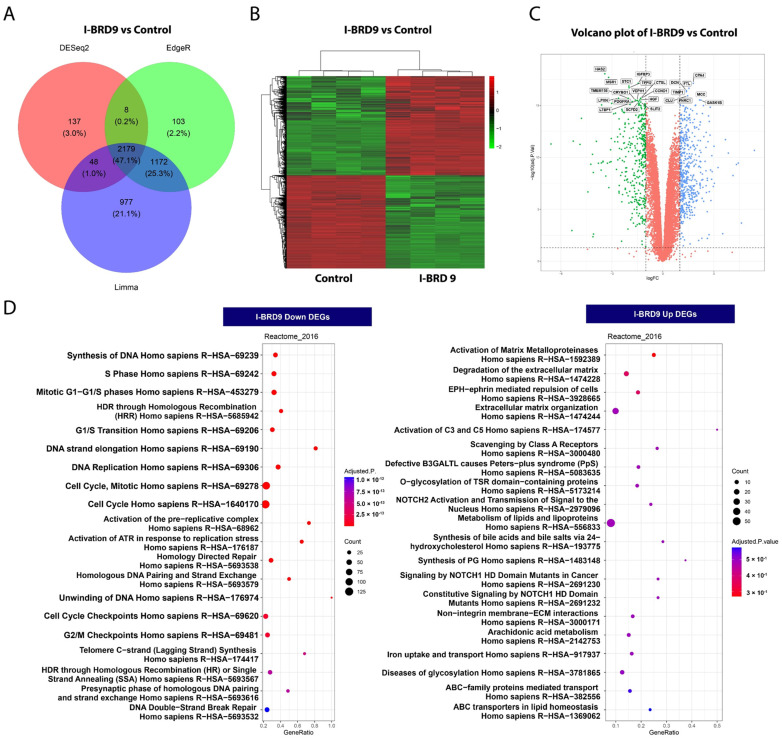
Figure 3.
Treatment with I-BRD9 sculpts the transcriptome of UF cells. (A) Venn diagrams demonstrating the overlap of DEGs identified via three methods of Limma + voom, edgeR, and DESeq2 at Adjusted p-value cut off 0.05 and −1.5 > log2FC > 1.5 for I-BRD9 vs. control. (B) Heatmap of I-BRD9 vs. control (DMSO) group. (C) Volcano plots of the gene expression profiles of I-BRD9 vs. control. (D) Reactome pathway analysis of DEGs. The dot plots show the top twenty enrichment terms associated with down DEGs (left panel) and up DEGs (right panel) in response to the I-BRD9 treatment. The x-axis represents the gene ratio, and the y-axis describes the enrichment components. The area of the cycle is proportional to the number of genes assigned to the term, and the color accords with the adjusted p-value.

