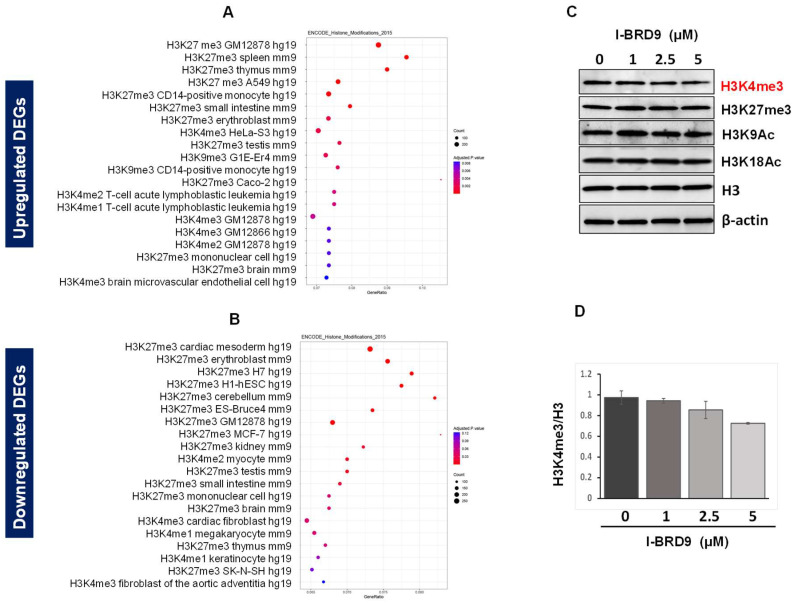
Figure 6.
Enrichment analysis for histone modifications. The dot plots showed the top twenty enrichment terms for histone modification associated with up DEGs (A) and down DEGs (B) in response to I-BRD9 treatment. The x-axis represents the gene ratio, and the y-axis describes the enrichment components. The area of the circle is proportional to the number of genes assigned to the term, and the color accords with the adjusted p-value. (C) The levels of histone marks, including H3K4me3, H3K27me3, H3K9Ac, and H3K18Ac, were examined via immunoblot analysis in HuLM cells in the presence (I-BRD9 (1–5 µM) or absence (DMSO) of I-BRD9. (D) The levels of H3K4me3 were quantified in HuLM cells in the presence or absence of I-BRD9 using NIH Image J.

