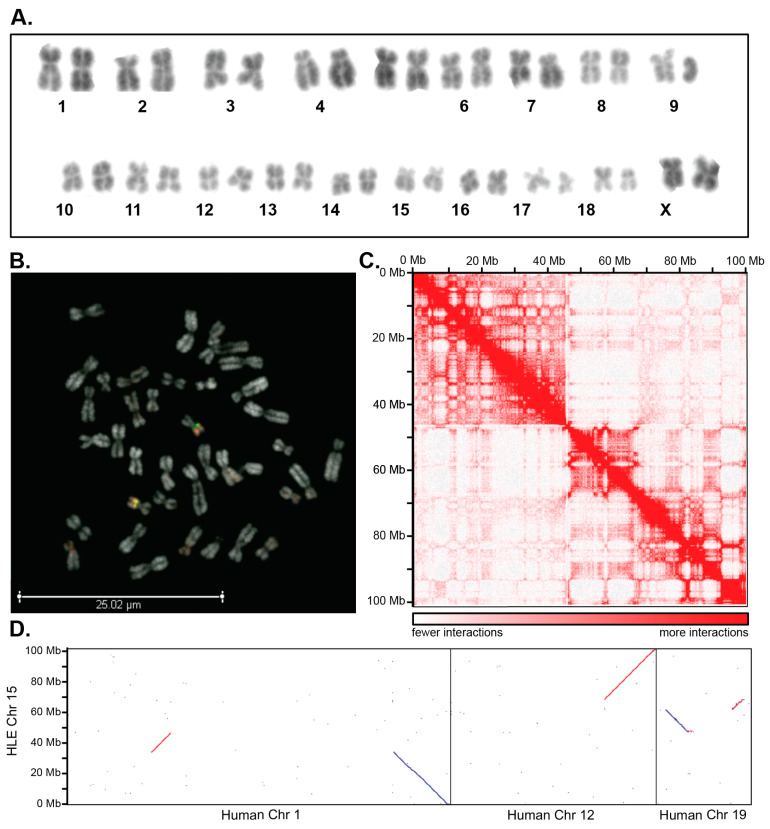
Figure 1.
Sequencing combined with cytogenetic techniques improves the resolution of chromosome rearrangements. (A) A karyotype for a female Eastern hoolock gibbon, Hoolock leuconedys (2n = 38). (B) A human locus probe for chr19p13.2 (green) and chr19q13.33 (red) on Hoolock leuconedys metaphase chromosome spreads reveals hybridization of both to the q arm of chromosome 15, suggesting a rearrangement in the Hoolock chromosome compared to human chromosomes. (C) An Omni-C contact map for chromosome 15 of the genome assembly Hoolock shows long-range chromatin interactions that form a characteristic plaid pattern of two mutually excluded (A,B) compartments. A-compartments correspond to gene-rich and active chromatin, while B-compartments are primarily enriched in repressive chromatin. Genomic coordinates are indicated on both axes, and a color code represents the contact frequency between regions on a scale where dark red represents high contact frequency and white represents low contact frequency. Combining assembly and contact frequency provides a more robust visualization of breakpoints involved in the chromosome rearrangement. (D) An alignment dot plot between assembled human (CHM13) chromosomes (horizontal) and Hoolock chromosome 15 (vertical) allows for accurate identification of the precise breakpoints along the Hoolock chromosome and depicts regions of synteny among the chromosomes (red line represents complementary alignments, blue line represents alignments in the reverse complement).

