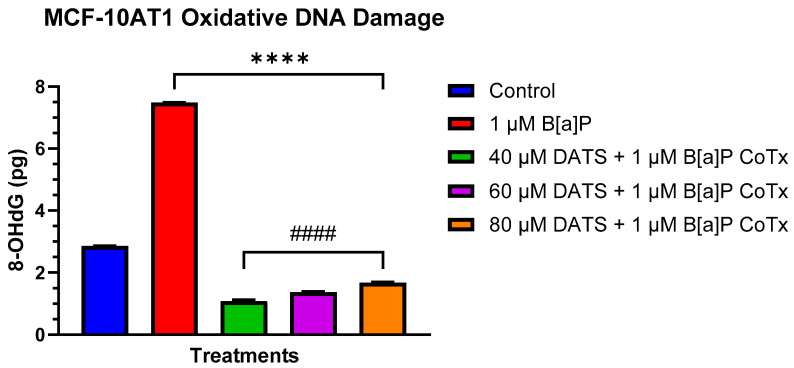
Figure 5.
DNA Damage Detection of MCF-10AT1 Cells Treated with DATS and/or B[a]P. MCF-10AT1 cells were treated with 1 μM B[a]P only or 1 μM B[a]P + 40–80 μM CoTx for 24 h. The graph displays 8-OHdG (picogram (pg) levels) as an indicator of oxidative DNA damage. The graph displays all experiments conducted in n = 8 and averaged for three biological replicates. The average values ± SEM display the results to determine significant differences using a t-test between the vehicle control and various treatment groups. (ns indicates no significance, **** p < 0.0001 compared with the control, and #### p < 0.0001 when compared with B[a]P treatment).

