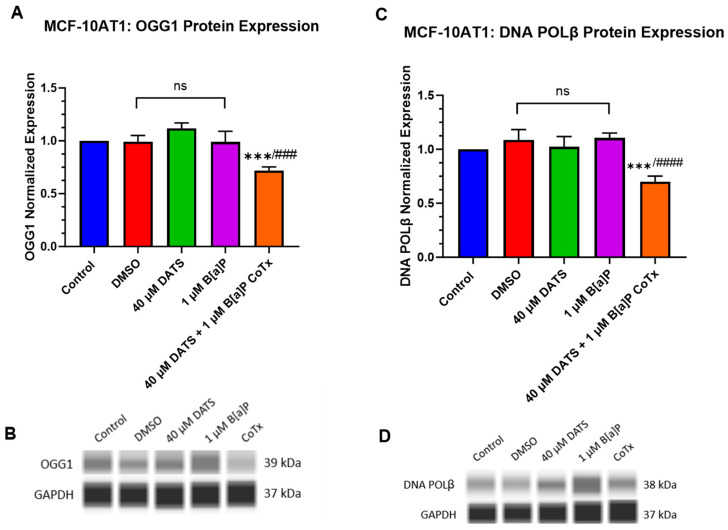
Figure 7.
Expression of OGG1 and POLβ in Premalignant (MCF-10AT1) Breast Epithelial Cells. OGG1 and POLβ protein expression was normalized and measured using densitometry (A–D). The protein expression of OGG1 and POLβ was measured using ProteinSimple SW Compass 6.2.0 software. The immunoblots represented the protein expression after 24 h-post treatment for OGG1 and POLβ. The graph displays all experiments conducted in n = 3 and averaged for three biological replicates. The average values ± SEM display the results to determine significant differences using one-way analysis of variance (ANOVA) followed by Dunnett’s Multiple Comparison Test between the vehicle control and various treatment groups. (ns indicates no significance, *** p < 0.001 compared with the control and ### p < 0.001, #### p < 0.0001 when compared with B[a]P treatment).

