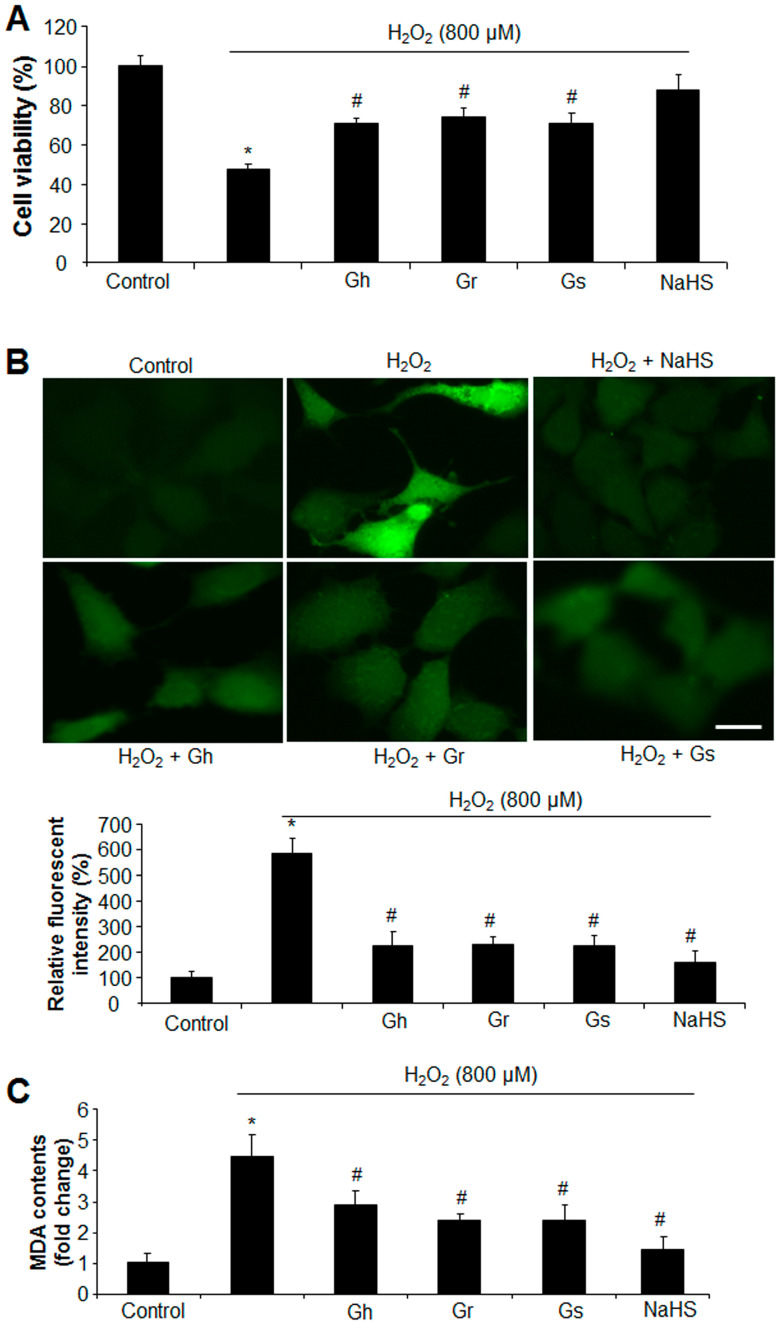
Figure 3.
GSLs and H2S protected cell death and oxidative stress induced by H2O2. Rat cardiac cells (H9C2) were exposed to 800 μM H2O2 in the presence of 10 μg/mL GSL or 30 μM H2S for 24 h. The cell viability was detected by MTT (A). ROS levels were examined by staining the cells with a fluorescent probe (H2DCFDA) (B). The fluorescent intensity was quantified with ImageJ software (Version 1.43) and normalized to the total cell number. The fluorescent intensity in control cells was considered 100%. Scale bar: 20 μm. Lipid peroxidation was also detected by measuring the content of MDA (C). * p < 0.05 versus control; # p < 0.05 versus H2O2 group. The experiments were repeated 4 times.

