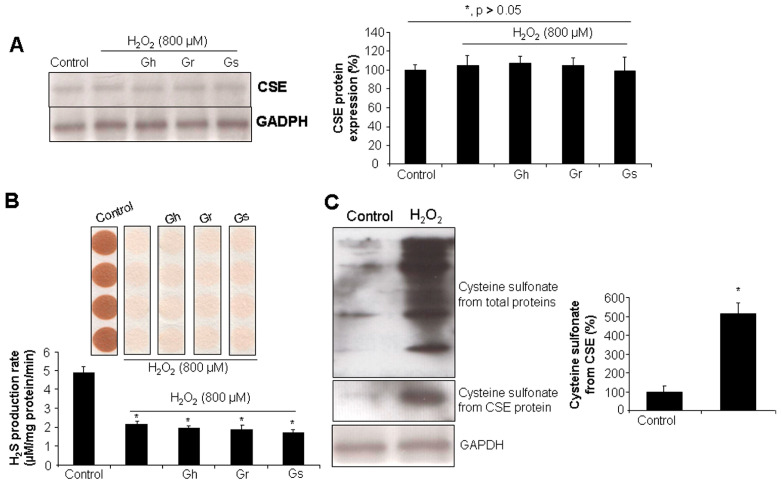
Figure 4.
The effects of H2O2 and/or GSLs on CSE protein expression and endogenous H2S generation. Rat cardiac cells (H9C2) were exposed to 800 μM H2O2 in the presence or absence of 10 μg/mL GSL for 24 h. The cells were then collected for CSE protein expression analysis by Western blot (A), H2S production rate analysis using lead acetate paper (B), and cysteine sulfonate production from CSE assessment using a Co-IP assay (C). In (A) * p > 0.05. In (B,C) * p < 0.05 versus control. The experiments were repeated 4 times.

