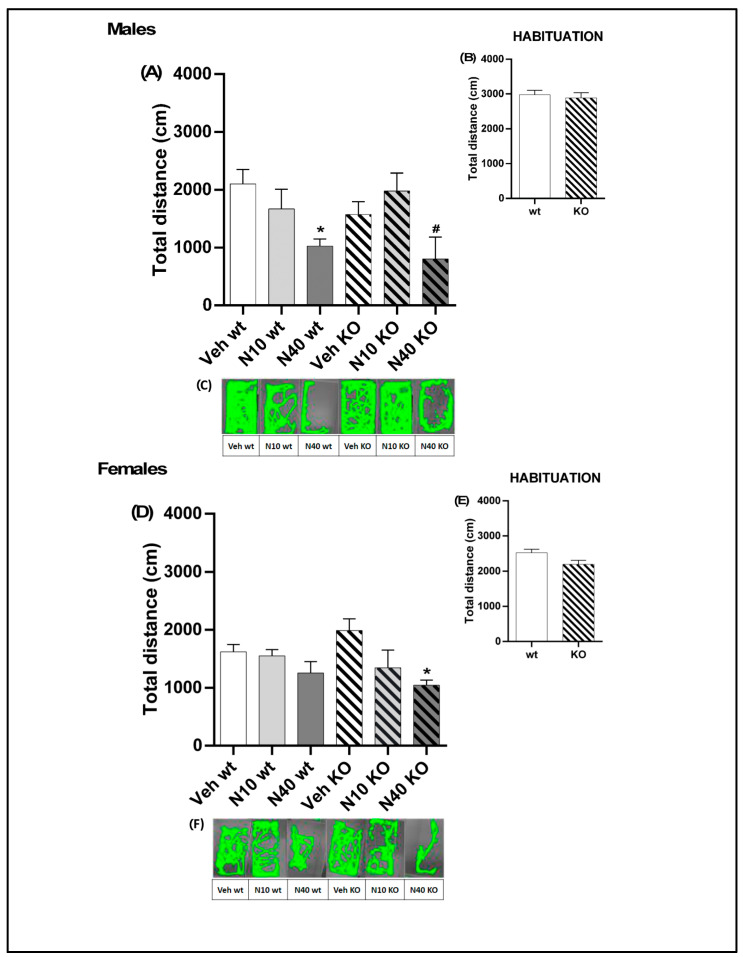
Figure 2.
Behavioral changes induced by noribogaine (N10, 10 mg/kg or N40, 40 mg/kg). For males: (A) Total distance traveled (cm) by mice post-injection with noribogaine. (B) Total distance traveled (cm) by mice during habituation. (C) Cumulative track plots (screen-captured from an Ethovision file) of mice during OFT post-injection with noribogaine. For females: (D) Total distance traveled (cm) by mice post-injection with noribogaine. (E) Total distance traveled (cm) by mice during habituation. (F) Cumulative track plots (screen-captured from Ethovision files showing openfield arenas used for locomotion measurements, see Methods for details) of mice during OFT post-injection with noribogaine. The values indicate mean ± SEM. Two-way ANOVA–Tukey: * p < 0.05 different from vehicle; # p < 0.05 different from noribogaine (low, N10 vs. high, N40 dose).

