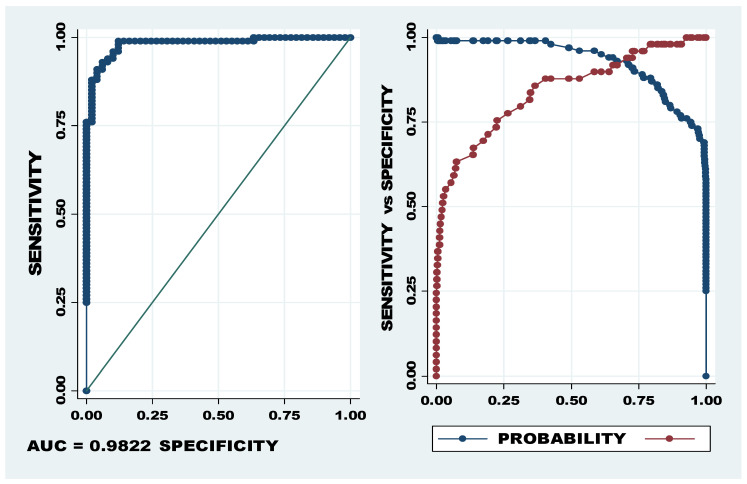
Figure 3.
AUC and probability cut-off of let-7a-5p, miR-320b/c. The first graph (LHS) showing sensitivity on the Y axis and specificity on the X axis depicts the AUC of 98.22% and the second graph shows the optimum cut-off point between sensitivity (blue) and specificity (red). The optimum cut-off, indicated as probability cut-off, in the second graph (RHS) indicates a specificity of 95.9% and specificity of 91.0%.

