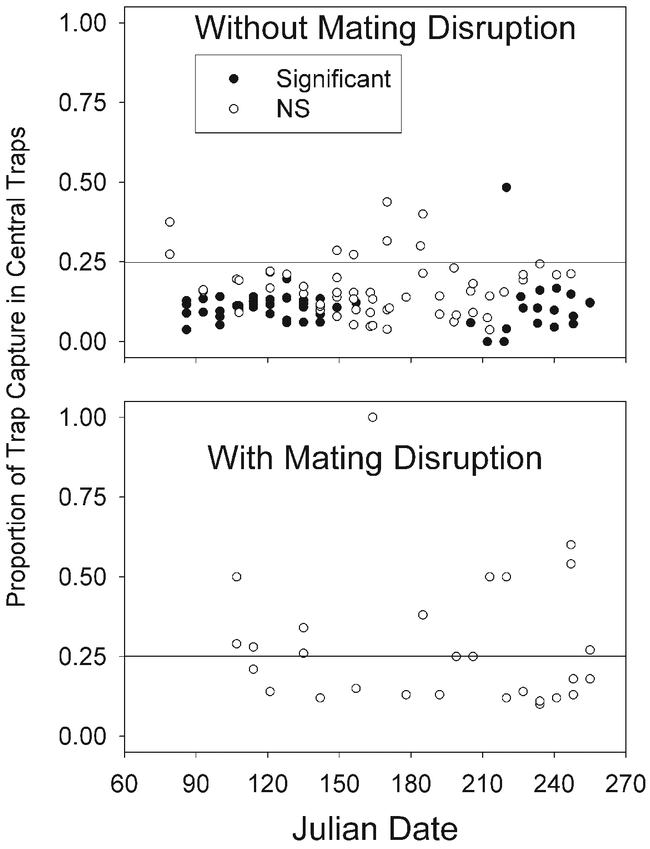
Figure 2.

Distribution of total capture between the four central and 16 peripheral traps, without mating disruption (upper), and with mating disruption (lower). The cross bar at 0.25 illustrates the expected distribution if all traps are equally likely to capture moths. The solid circles represent observed that differ significantly from the expected values for a 0.25/0.75 central/peripheral capture ratio, and the unfilled circles represent observations not significantly different from the expected values.
