Figure 5.
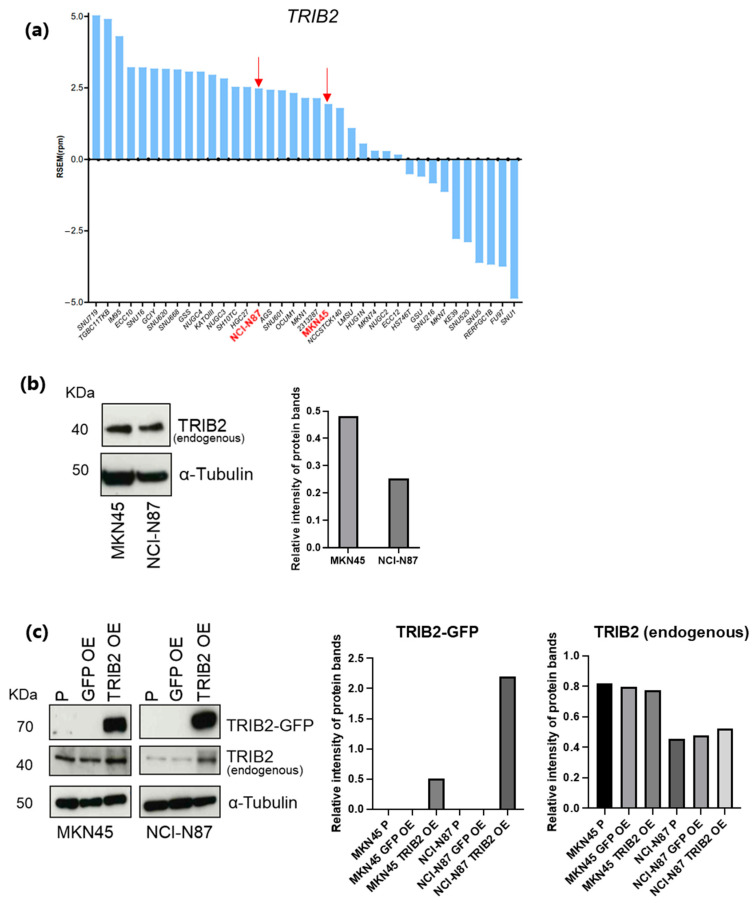
Modulation of TRIB2 expression in CIN GC cell lines. (a) Bar graph representing the expression level of TRIB2 mRNA in GC cell lines included in the CCLE database. MKN45 and NCI-N87 cells are highlighted in red and bold as they were selected for subsequent experiments. (b) Western blot (WB) showing the endogenous expression of TRIB2 protein in MKN45 and NCI-N87 cells. α-tubulin was used as internal control. The right panel reports the quantification of the bands normalized to α-tubulin. (c) WB showing endogenous and ectopic (fused with GFP) TRIB2 protein expression in untransfected parental (P), GFP overexpressing (GFP OE), and TRIB2 overexpressing (TRIB2 OE) MKN45 and NCI-N87 cells. α-tubulin was used as internal control. The panels on the right illustrate the quantification of the bands normalized to α-tubulin.

