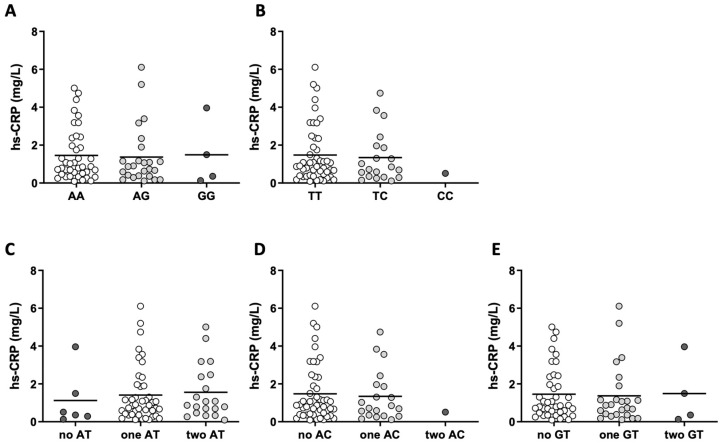
Figure 1.
Levels of high-sensitivity C-reactive protein (hs-CRP) in all genotype (A,B) and haplotype (C–E) subgroups. Differences between the genotype and haplotype subgroups showed no statistical significance for hs-CRP (p > 0.05). Kruskal–Wallis (A,C,E) or Mann–Whitney U (B,D) tests were used to compare the differences in hs-CRP.

