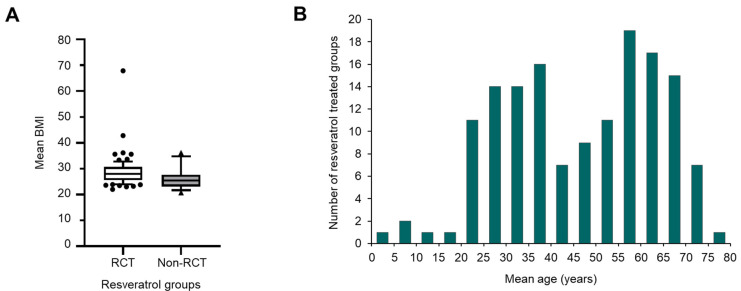
Figure 5.
Characteristics of participants in RSV trials. (A) Comparison of the mean BMI value of participants taking RSV in RCTs versus non-RCTs. Where there is more than one group receiving RSV, the mean BMI has been calculated for the trial. Values are available from 78 of the 104 RCTs and 19 of the 51 non-RCTs. The graph shows the median value for each group, with the box indicating the 25th to 75th percentiles and the whiskers corresponding to the 10th and 90th percentiles. (B) Shows the mean age distribution of RSV-treated participants across all trials where this has been reported. In trials involving multiple groups receiving RSV, the mean age of each group has been included. Mean age data were not available for 39 out of 155 trials. The data presented relate to all references cited in Table 1 and Table S1.

