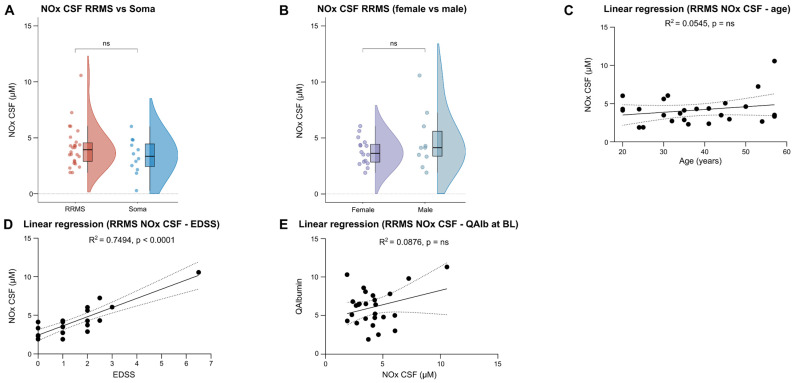
Figure 2.
CSF NOx levels do not differ significantly between RRMS and Soma patients. (A,B) Violin plots with overlaying box plots comparing two groups. Boxes display the median as well as the 25th and 75th percentiles. The whiskers extend from the hinge to the largest and smallest values, respectively, but no further than 1.5 * IQR from the hinge. (C,D) Simple linear regression using either age or EDSS as independent and NOx CSF as dependent variable. The area in-between the dotted lines shows the 95% confidence band. (E) Simple linear regression using NOx CSF as independent and QAlbumin as dependent variable. The area in-between the dotted lines shows the 95% confidence band. BL—Baseline, CSF—Cerebrospinal fluid, EDSS—Expanded Disability Status Scale, IQR—Interquartile range, NOx—Nitrosative stress molecules, ns—Not significant, Q—CSF/serum ratio, RRMS—Relapsing–remitting Multiple Sclerosis, Soma—Somatic symptom disorder.

