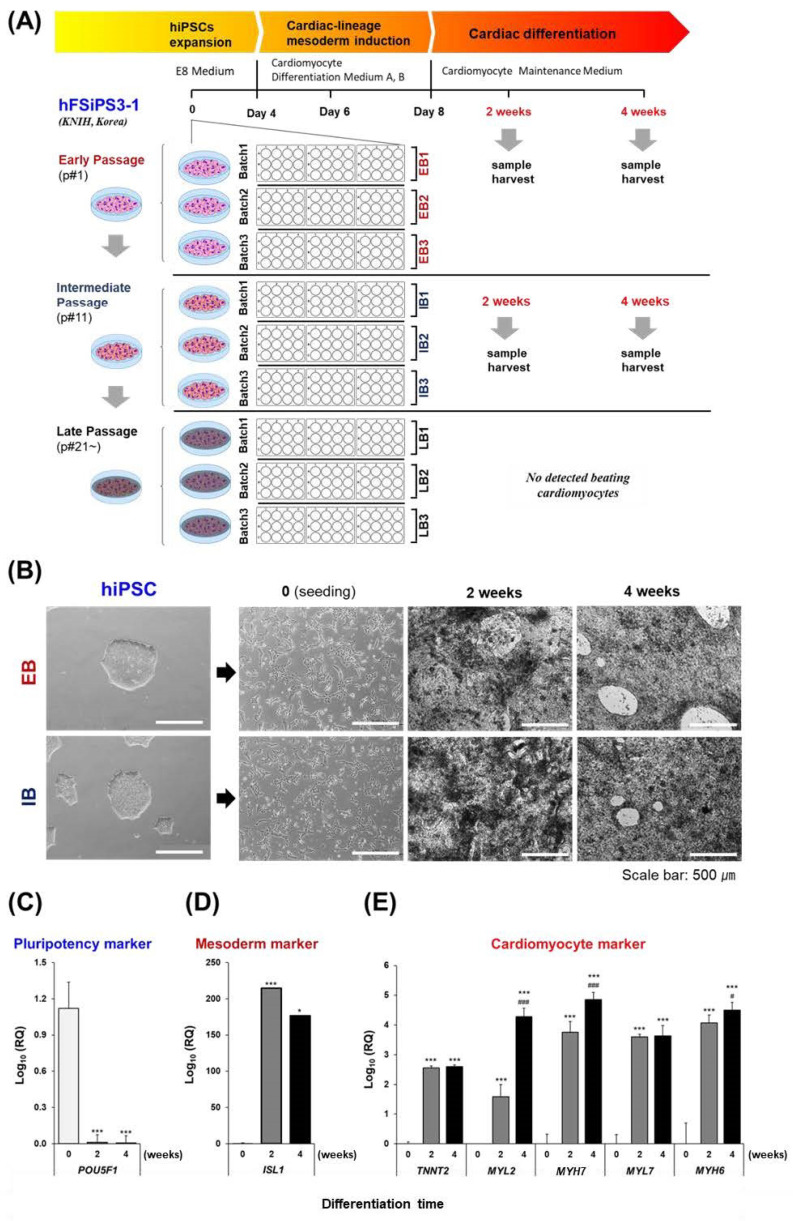
Figure 1.
Experimental scheme and assessment of hiPSC-CM differentiation. (A) Experimental Design: hiPSCs from three passages (EB, IB, or LB) were subjected to CM differentiation for 0, 2, or 4 weeks. (B) Time-lapse images of CMs at different stages of differentiation were obtained using an inverted microscope at 4× magnification, and the scale bar represents 500 µm. (C) Quantification of POU5F1 expression levels in undifferentiated hiPSCs. (D) Quantification of ISL1 expression levels, a marker associated with mesoderm, during hiPSC differentiation. (E) Quantification of gene expression levels associated with cardiomyocytes (TNNT2, MYL2, MYH7, MYL7, MYH6) during the differentiation process. * indicates p < 0.05, *** indicates p < 0.001 compared to the 0 week of each hiPSC-CM group. # indicates p < 0.05, ### indicates p < 0.01 compared to the 2 weeks of each hiPSC-CM group. hiPSCs, human-induced pluripotent stem cells; CMs, cardiomyocytes; hiPSC-CMs, hiPSC-derived CMs; EB, early batch; IB, intermediate batch; LB, late batch; POU5F1, POU class 5 homeobox 1; ISL1, ISL LIM homeobox 1; TNNT2, troponin T2; MYL2, myosin light chain 2; MYH7, myosin heavy chain 7; MYL7, myosin light chain 7; MYH6, myosin heavy chain 6; RQ, relative quantification.

