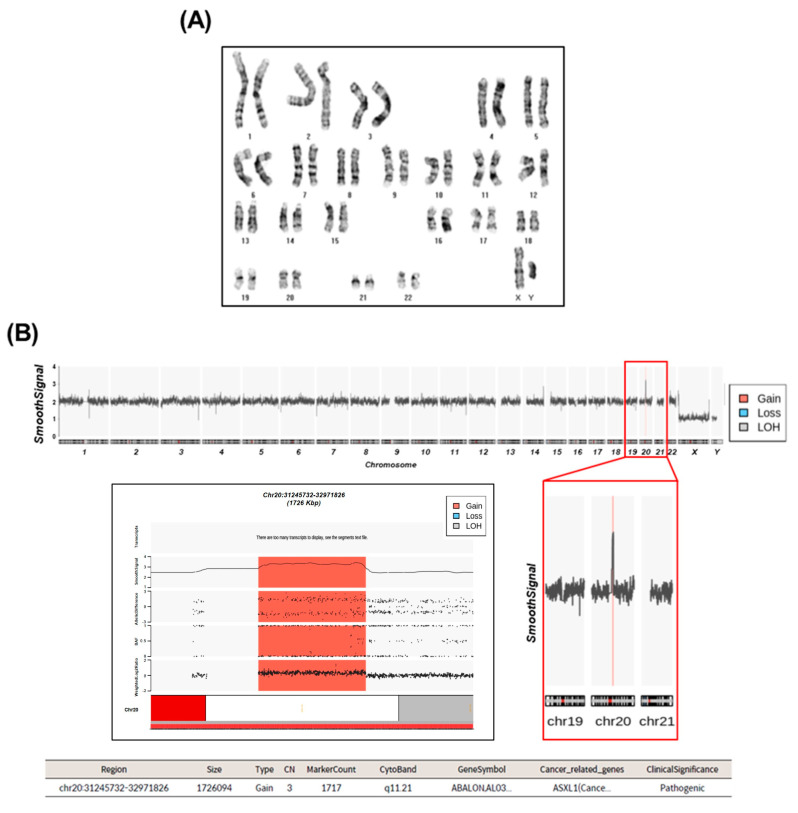
Figure 2.
Cytogenetic analysis of hiPSCs. (A) G-banding karyotyping results display the overall structure of chromosomes. (B) CytoscanHD results illustrate chromosome structure and changes in copy numbers. In the smooth signal of the entire chromosome, the orange line indicates a ‘Gain’. The magnified view of this region (highlighted by the red box) precisely reveals the location of the variant within chromosome 20. B-allele frequency, weighted Log2Ratio, and allele difference data elucidate intricate variations in copy numbers in the identified mutation region. The table provides information on genetic details and clinical significance associated with the copy number variant using ClinVar. LOH, loss of heterozygosity; CN, copy number.

