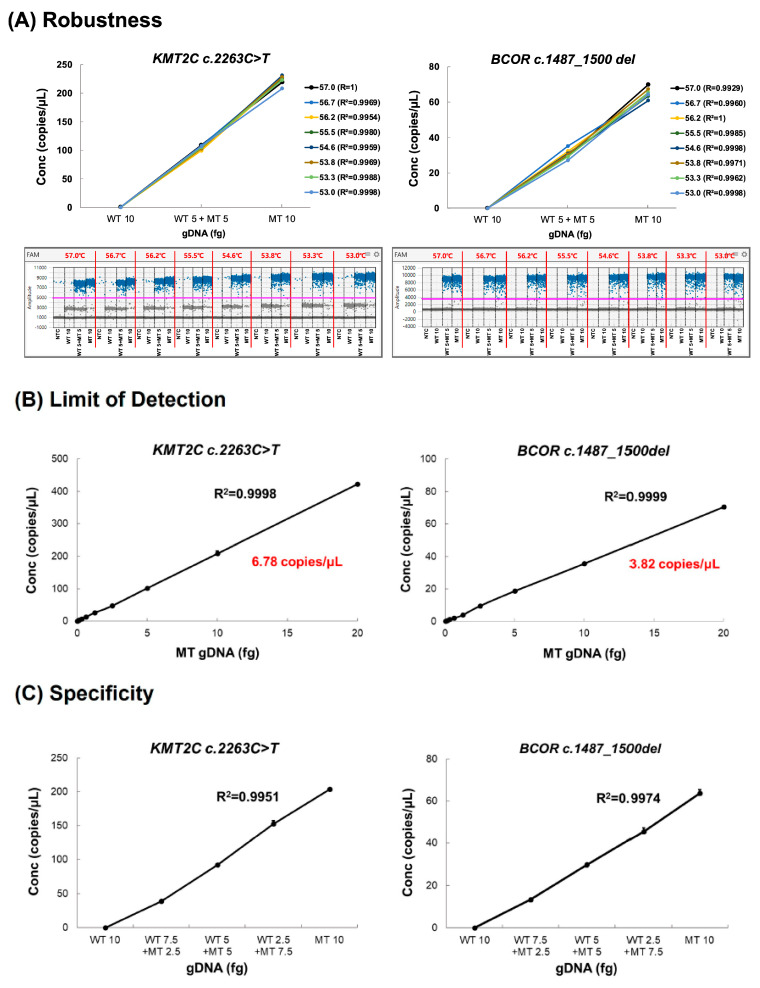
Figure 5.
Validation of KMT2C and BCOR variants using ddPCR. (A) Robustness. The control sample was run by ddPCR using several temperatures for the annealing/extension steps (53–57 °C). The positive droplets are represented in blue dot, whereas negative droplets are in black dot. Red lines indicate the separation between the different temperatures, and the pink line represents the set fluorescence threshold to distinguish positive and negative droplets. (B) LOD. Two-fold dilutions of the MT control were run in three replicates. The LOD was defined as the lowest concentration of target genetic variation that can be detected with a %RSD <5%. (C) Specificity. The R2 results from the experiments with gradient mixed control were >0.99. Data are presented as means ± SD. LOD, limit of detection; Conc, concentration.

