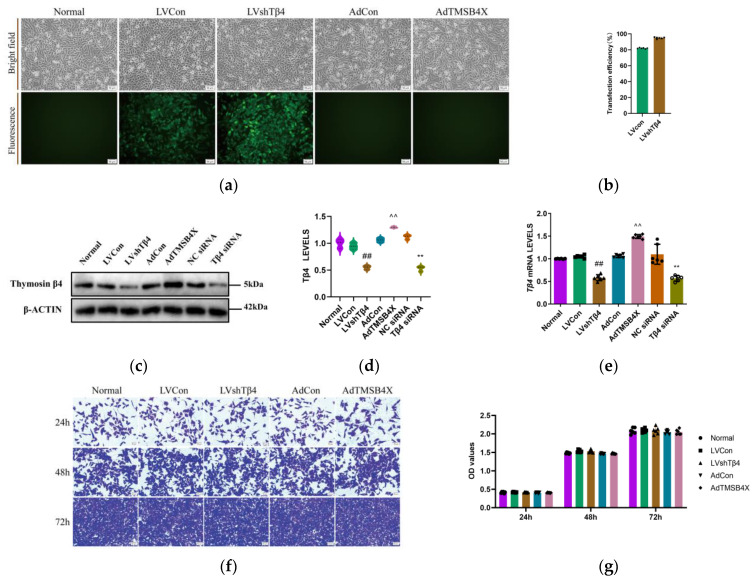
Figure 1.
Analysis of Tβ4 levels and cell proliferation capacity. (a) Representative bright field and fluorescence images of cells from the Normal, LVCon, LVshTβ4, AdCon, and AdTMSB4X groups. Scale bar = 50 μm; (b) Lentivirus transfection efficiency data for LVCon and LVshTβ4 groups; (c) Representative Western Blot images of β-ACTIN, Thymosin β4; (d) Statistical results of Tβ4 levels. Protein levels were normalized using the corresponding β-ACTIN level; (e) Tβ4 mRNA levels in Normal, LVCon, LVshTβ4, AdCon, AdTMSB4X, NC siRNA, and Tβ4 siRNA groups. mRNA levels were normalized to GAPDH mRNA levels using the 2−ΔΔCt method. (f) Representative images of crystal violet staining at 24 h, 48 h, and 72 h for Normal, LVCon, LVshTβ4, AdCon, and AdTMSB4X groups. Scale bar = 50 μm; (g) Crystal violet staining results at 24 h, 48 h, and 72 h for Normal, LVCon, LVshTβ4, AdCon, and AdTMSB4X groups. One-way ordinary ANOVA tests were used in (b,d,e), and a two-way ANOVA test was used in (g). Data for (b,d,e,g) are presented as mean ± SEM from at least three independent experiments. Statistical significance was determined by comparing with the LVCon group (## p < 0.01), AdCon group (^^ p < 0.01), and NC siRNA group (** p < 0.01).

