Figure 2.
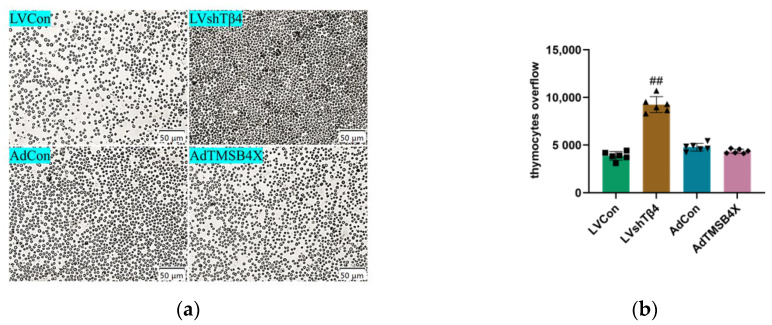
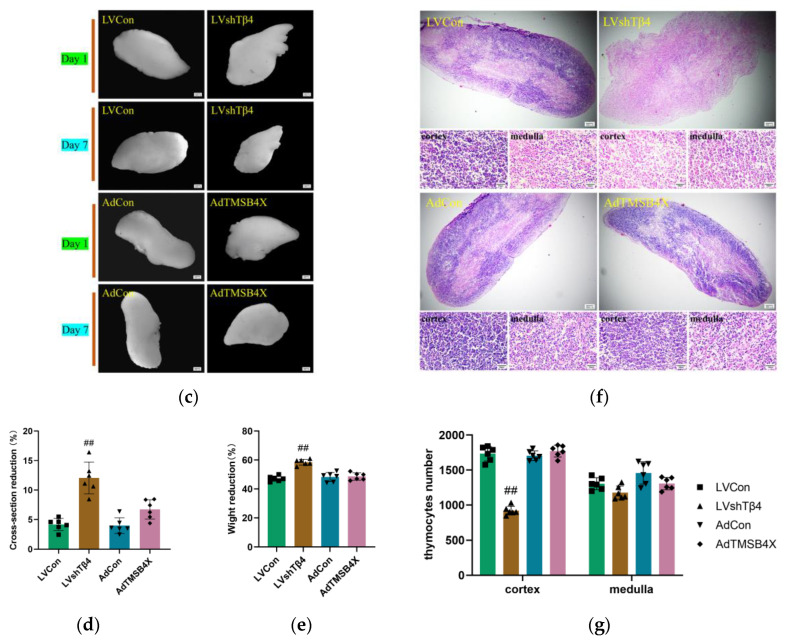
Impact of Tβ4 on thymus morphology, structure, and cell number. (a) Representative images of thymocytes overflow in LVCon, LVshTβ4, AdCon, and AdTMSB4X groups. Scale bar = 50 μm; (b) Statistical results of (a); (c) Representative images of the thymus captured with a stereo microscope in LVCon, LVshTβ4, AdCon, and AdTMSB4X groups. Scale bar = 250 μm; (d) Maximum cross-section reduction of thymus (%) in LVCon, LVshTβ4, AdCon, and AdTMSB4X groups; (e) Wight reduction of thymus (%) in LVCon, LVshTβ4, AdCon, and AdTMSB4X groups; (f) H&E representative images of thymus in LVCon, LVshTβ4, AdCon, and AdTMSB4X groups. Scale bar = 250 μm (upper), 50 μm (lower); (g) The counting area for the lower image in (f). Statistical results of cortical and medullary thymocyte numbers in LVCon, LVshTβ4, AdCon, and AdTMSB4X groups. One-way ordinary ANOVA tests were used in (b,d,e), and a two-way ANOVA test was used in (g). Each symbol represents a separate data point. Data for (b,d,e,g) are presented as mean ± SEM from at least three independent experiments. Statistical significance was determined by comparing it with the LVCon group (## p < 0.01).


