Figure 3.
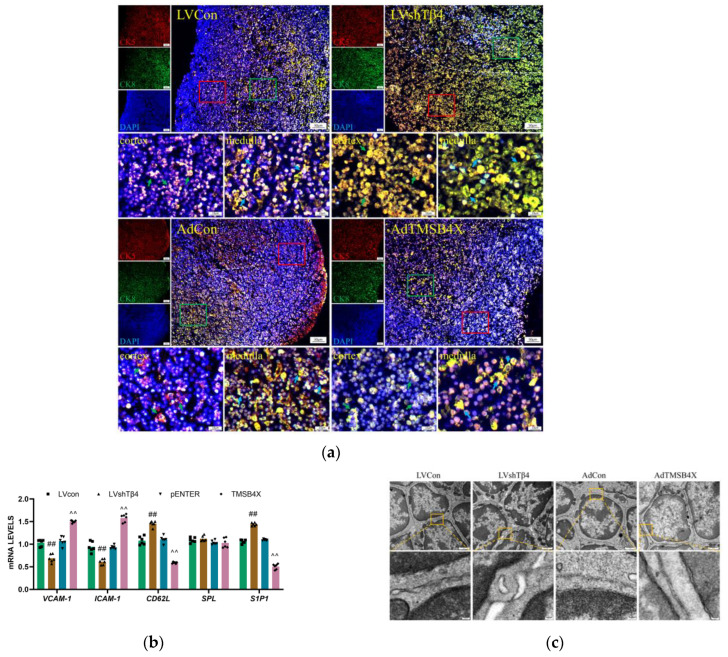
TEC differentiation and spatial distribution. (a) Representative immunofluorescence images of CK5 (red) and CK8 (green) in the 7-day cultured thymus, with nuclei stained using DAPI (blue). Dotted lines outline cortical and medullary regions. Representative immunofluorescence images of enlarged selected areas in the red and green boxes, green arrows indicate cTECs, and blue arrows indicate mTECs. Scale bar = 50 μm (upper), 10 μm (lower); (b) Statistical result of mRNA levels of VCAM-1, ICAM-1, CD62L, SPL, and S1P1 in the thymus detected by qPCR. mRNA levels were normalized using GAPDH by the 2−ΔΔCt method; (c) Representative images of thymocytes captured by transmission electron microscope and enlarged images of the selected areas in the orange boxes. Scale bar = 1 μm (bigger), 100 nm (smaller); (d) Representative images of thymocytes captured by transmission electron microscope with enlarged images of selected areas in the orange boxes. Blue arrows indicate mitochondria. Scale bar = 1 μm (bigger), 100 nm (smaller); (e) The counting area for the larger image in (d) and the statistical results of the number of mitochondria. A one-way ordinary ANOVA test was used in (e), and a two-way ANOVA test was used in (b). Each symbol represents a separate data point. Data for (e,b) are presented as mean ± SEM from at least three independent experiments. Statistical significance was determined by comparing the LVCon group (## p < 0.01) and the AdCon group (^ p < 0.05, ^^ p < 0.01).


