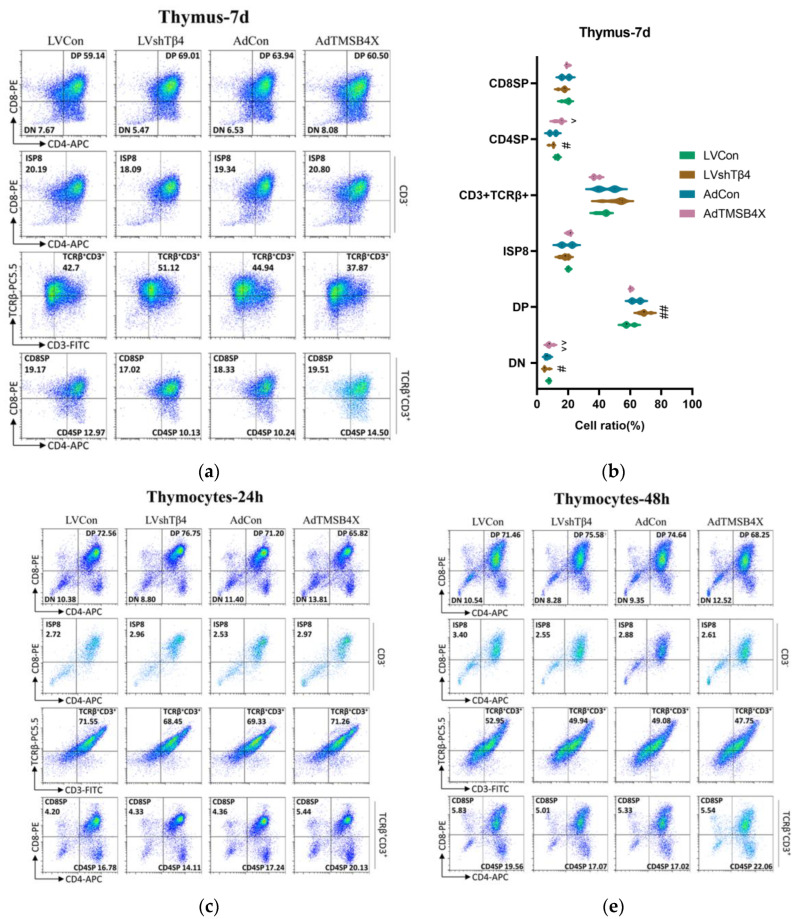
Figure 4.
Thymocyte differentiation and development. (a) Flow cytometry results depicting thymocyte differentiation from thymus cultured for 7 days in vitro; (b) Statistical results of (a); (c) Flow cytometry results showing thymocytes cultured for 24 h in vitro; (d) Statistical results of (c); (e) Flow cytometry results illustrating thymocytes cultured for 48 h in vitro; (f) Statistical results of (e). Percentage frequencies of double-negative (DN) cells (CD4−CD8−), double-positive (DP) cells (CD4+CD8+), immature single-positive CD8+ (ISP8) cells (CD3−CD4−CD8+), and TCRβ+CD3+ in total cells. Percentage of mature single-positive CD8+ (CD8SP) cells (CD3+TCRβ+CD4−CD8+) and mature single-positive CD4+ (CD4SP) cells (CD3+TCRβ+CD4+CD8−) in thymus TCRβ+CD3+ cells. A two-way ANOVA test was used in (b,d,f). Data for (b,d,f) are presented as mean ± SEM from at least three independent experiments. Statistical significance was determined by comparing the LVCon group (# p < 0.05, ## p < 0.01) and the AdCon group (^ p < 0.05, ^^ p < 0.01).


