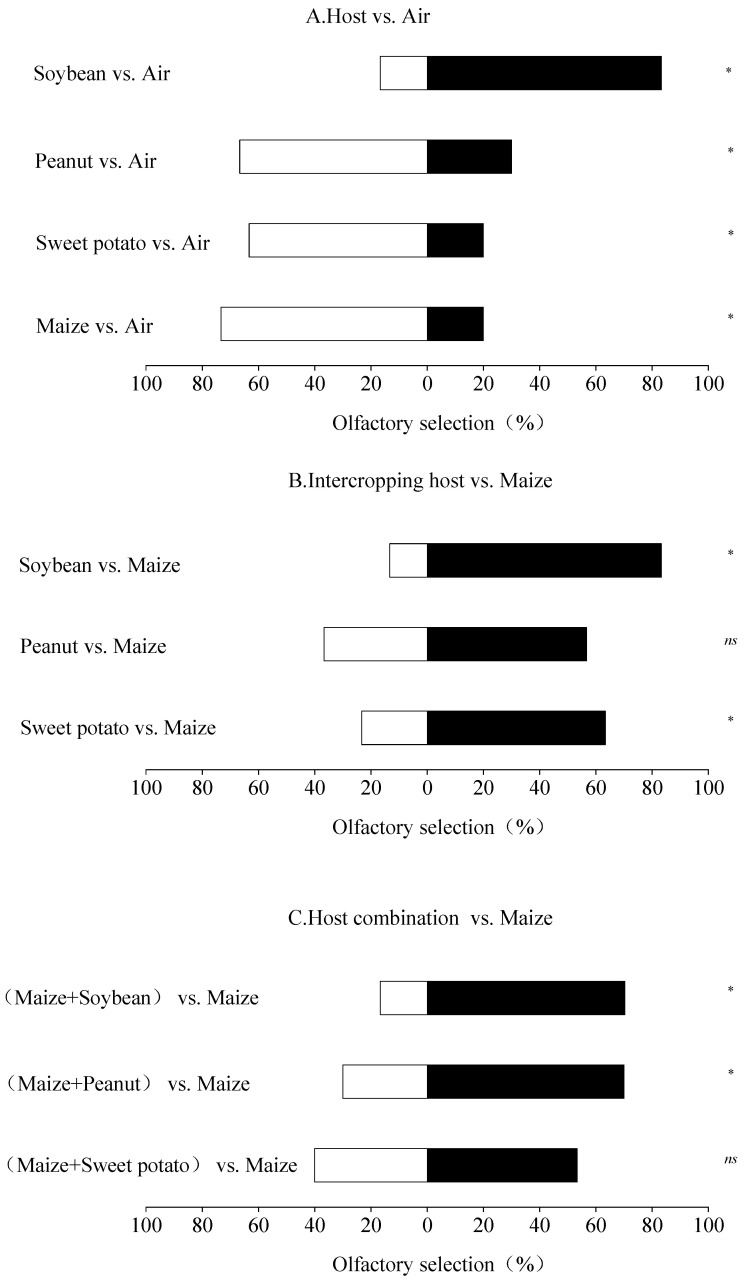
Figure 2.
Olfactory selection of FAW adults for maize and the other three plants (A–C). Note: The values in the horizontal coordinates of the graph are the percentage of selection; * indicates significant differences (chi-square test, p < 0.05); and ns indicates no significant differences (chi-square test, p > 0.05). A chi-square test was conducted using the actual number of adults selected.

