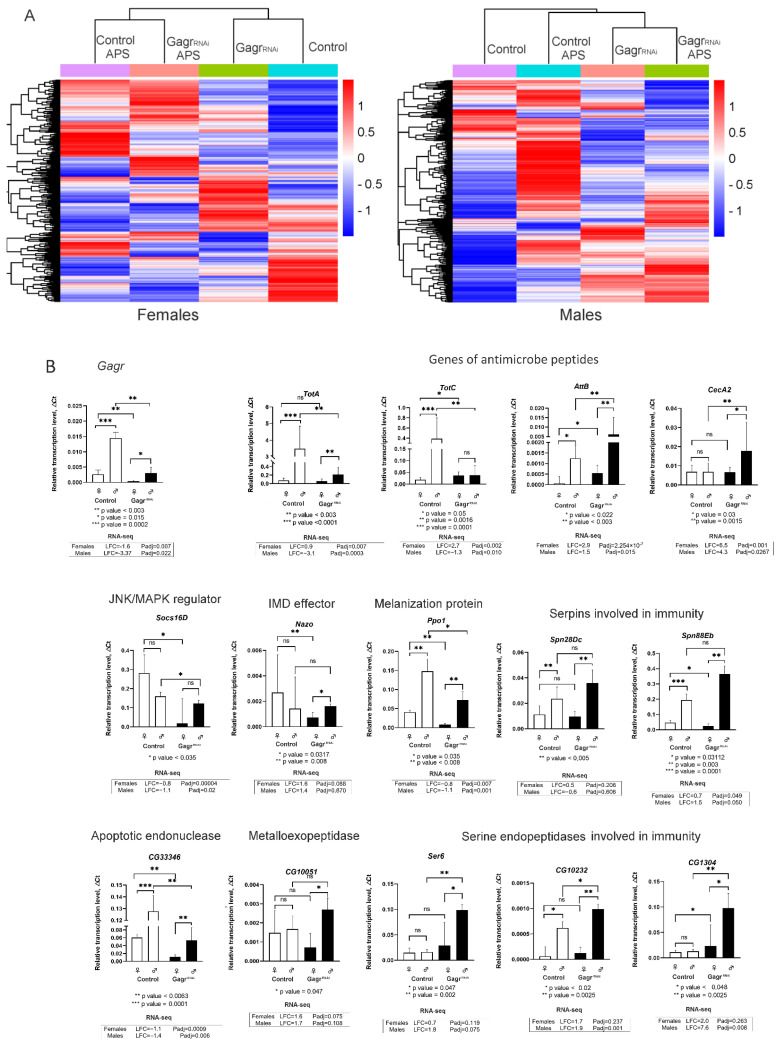
Figure 2.
Differently expressed genes in the GagrRNAi and control flies. (A) Heatmap of transcriptomes of the control and GagrRNAi flies during standard and APS stress conditions. (B) RT-PCR analysis of transcription level of Gagr and 14 immune response genes with differential expression according to RNA-seq in GagrRNAi and control flies. Above diagrams, ns—not significant. Under diagrams, LFC values for RNA-seq data are shown.

