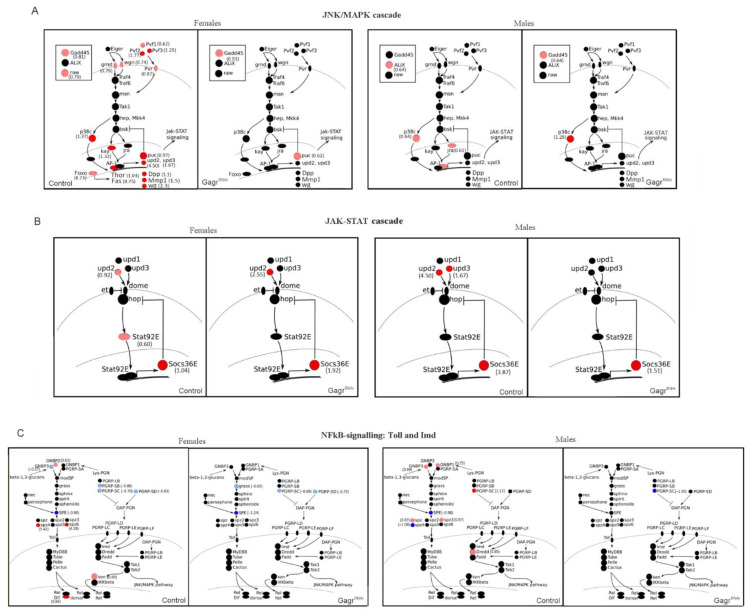
Figure 6.
Transcription response to APS of the JNK/MAPK (A), JAK/STAT (B), Toll and Imd (C) signaling pathway genes in the control and GagrRNAi females and males. Genes that changed transcription by more than 2 times are shown in red (increase) and blue (decrease). Genes that changed transcription significantly, but not more than 50%, are shown in pink or light blue; genes that did not change transcription are shown in black. The LFC values are shown in brackets.

