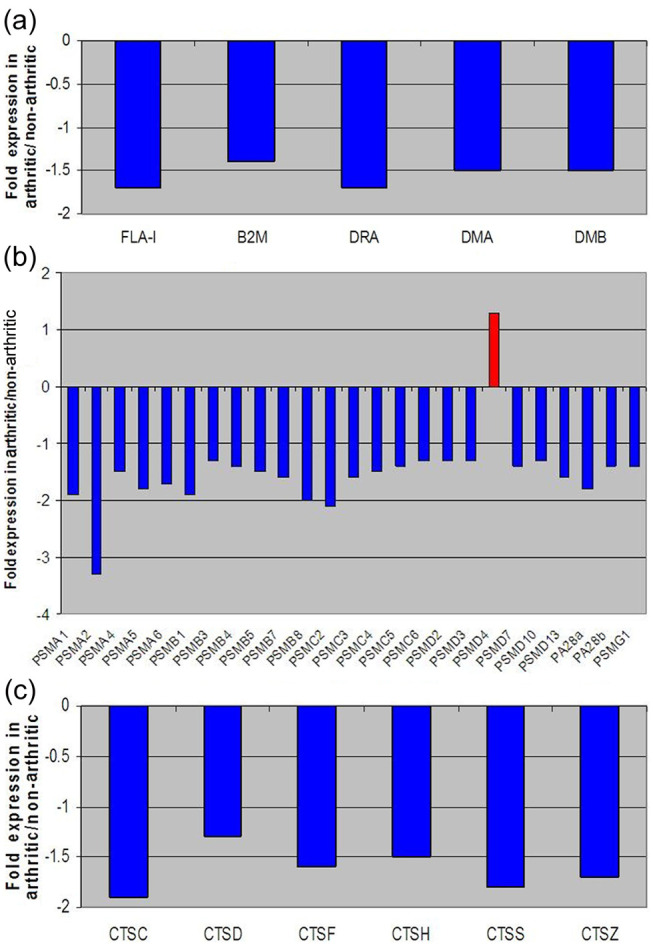
Figure 2.

Fold change expression levels of key genes involved in antigen presentation. (a) Major histocompatibility complex (MHC) molecules; (b) proteasome and (c) cathepsin in degenerative joint disease (DJD) versus control populations. These graphs list fold changes in specific MHC class I and II (a), proteasome (b) and cathepsin (c) genes between DJD and non-DJD populations. All negative fold changes reflect down-regulation of the gene in DJD animals compared with non-DJD animals, and are represented in blue. All positive fold changes reflect up-regulation of the gene in DJD animals compared with non-DJD animals, and are represented in red
