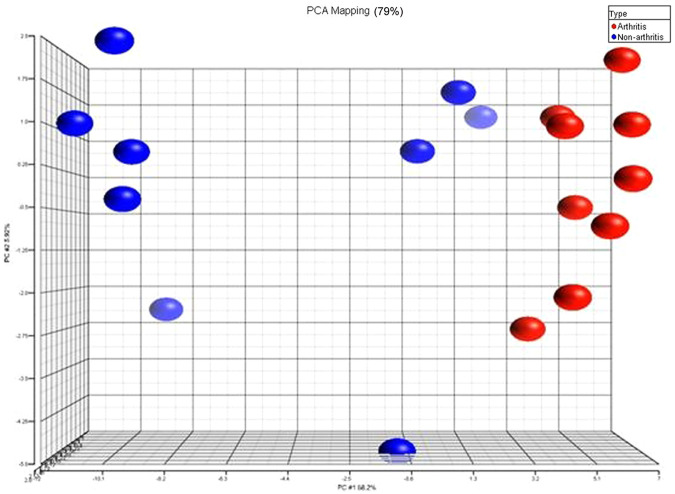
Figure 6.
Principal component analysis (PCA) of the differentially expressed proteins found in differentially joint disease (DJD) cats compared with control populations. DJD cat data (n = 9) are shown in red, whilst non-DJD cats (n = 9) are represented by blue, and each spot represents one pooled sample

