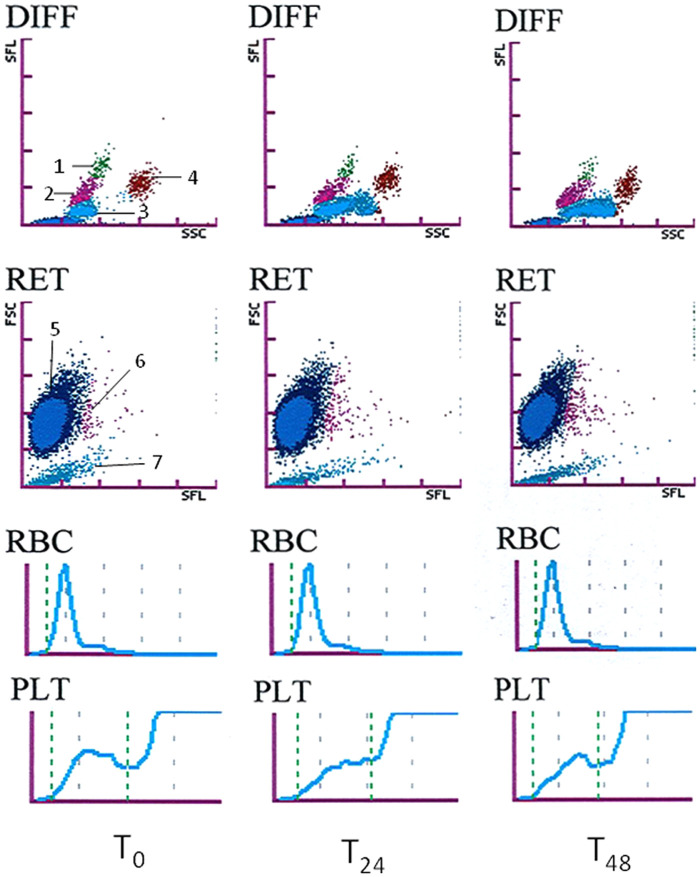
Figure 2.
Classical example of the changes in white blood cell differential (DIFF), reticulocyte (RET) and platelet (PLT-O) scattergrams (optical measurement), red blood cell (RBC) and platelet (PLT) histograms (impedance measurement) in the ethylenediamine tetra-acetic acid plus citrate, theophylline, adenosine and dipyridamole (EDCT) blood sample from a cat (the same one as in Figure 1) at T0 and after storage at room temperature in the dark for 24 (T24) and 48 (T48) h. Description of the dot plot: 1 = monocytes, 2 = lymphocytes, 3 = neutrophils, 4 = eosinophils, 5 = red blood cells, 6 = reticulocytes and 7 = platelets

