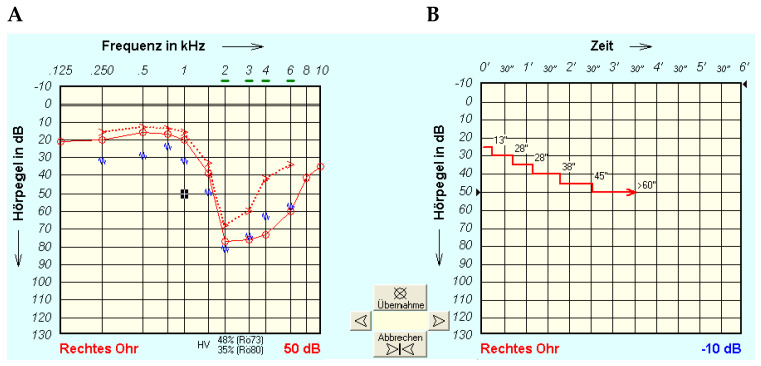
Figure 1.
Representative tone decay test performed at 1 kHz and final stimulation at 50 dB HL, 30 dB above hearing threshold. (A) Hearing threshold (red circle), the bone conduction threshold (red arrow pointing to the right), and the contralateral masking level (blue wave). (B) Change if sound level over time during the tone decay test (TDT).

