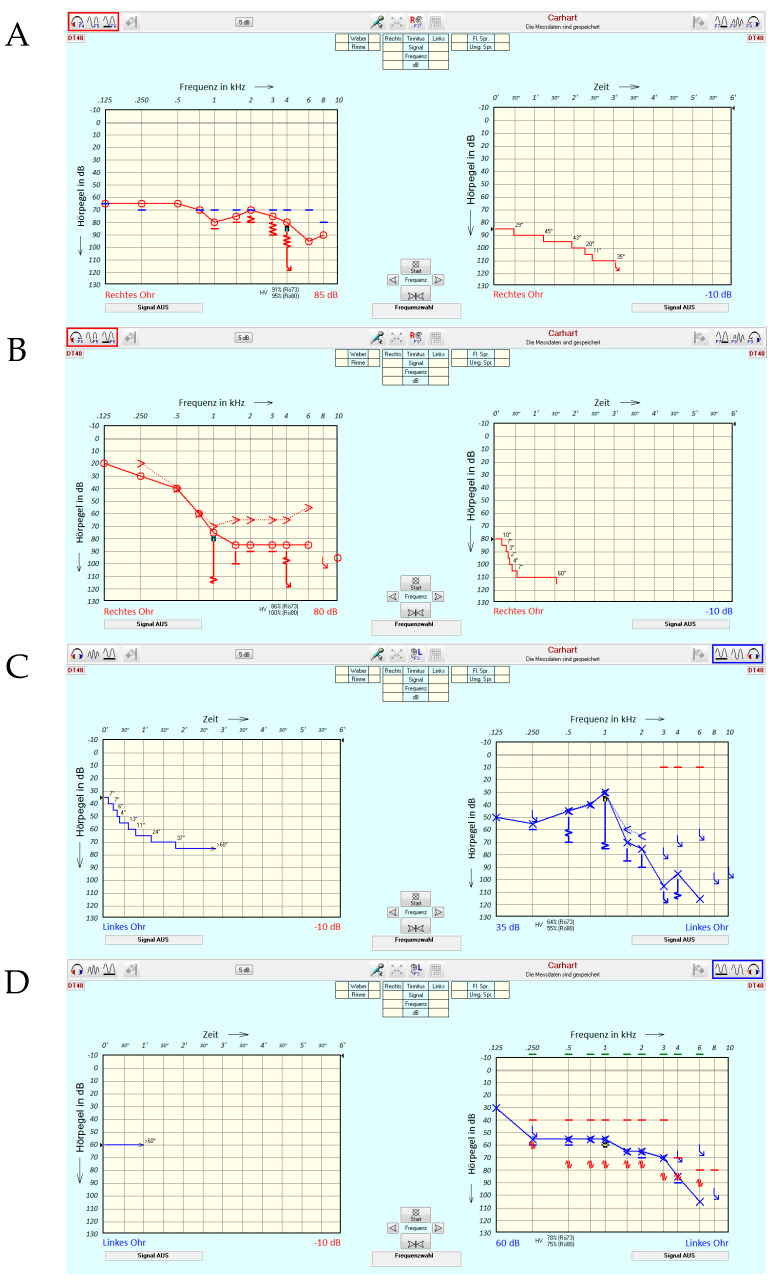
Figure 2.
Case examples of different tone decay test (TDT) characteristics. (A–D) Case examples. For right-ear cases (red), the graph on the left shows the pure-tone audiogram and that on the right shows the time course of the TDTs. The ordinate corresponds to the presentation level in dB HL. The colours red and blue correspond to measurements of the right and left ear, respectively. The actual test frequency is indicated by a black square symbol on the left while the precise course of TDT is displayed on the right for right ears and vice versa for left ears. The highlighted squares in red and blue in the upper right and left corner visualize the measurement condition.

