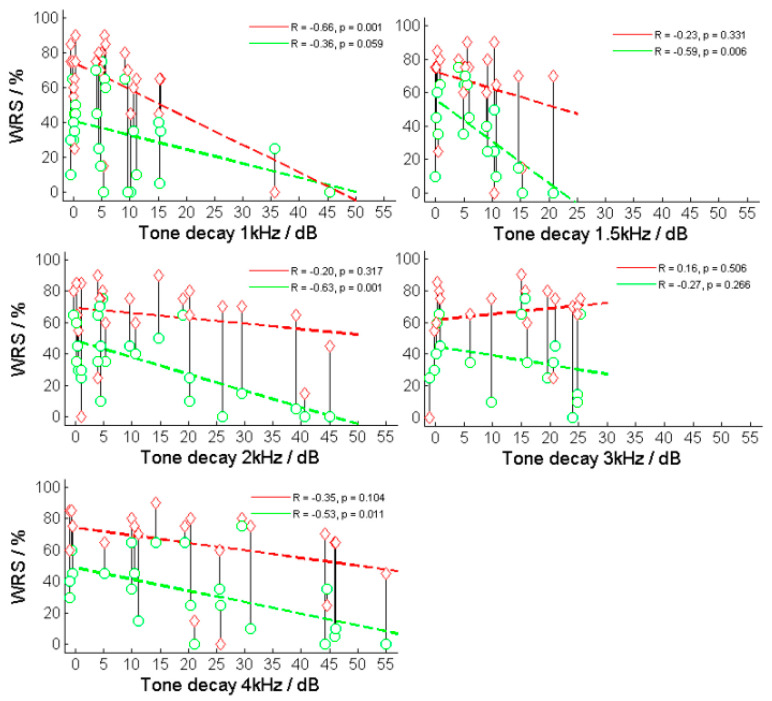
Figure 6.
Relation between maximum and aided word recognition scores (WRSmax and WRS65(HA)) and tone decay (TD) at different frequencies. The red diamonds and lines correspond to the relationship between TD and WRSmax, while the green circles and lines correspond to the relationship between TD and WRS65(HA).

