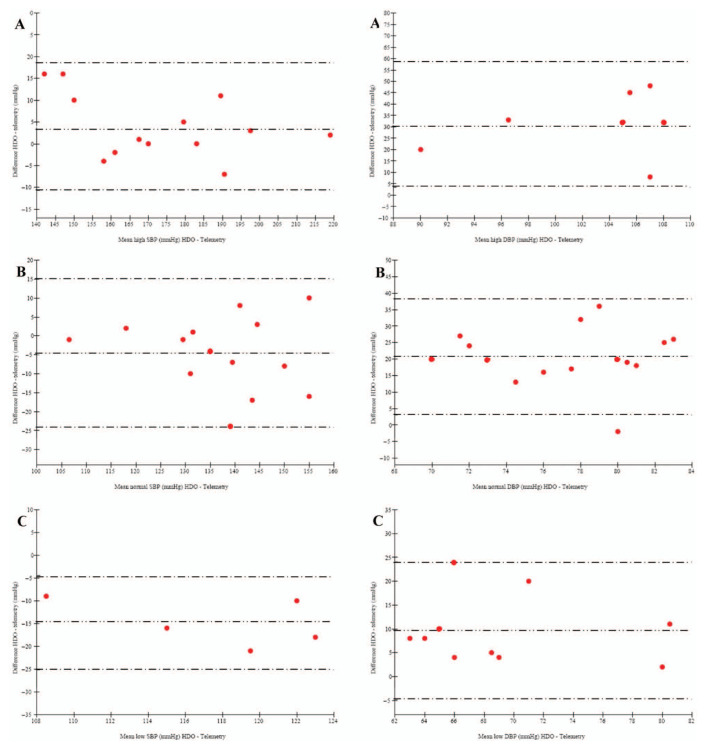
Figure 3.
Bland–Altman plot of agreement between systolic blood pressure (SBP) and diastolic blood pressure (DBP) measured with high-definition oscillometry (HDO) and telemetry in cat number 2008018 according to subgroups (A = high; B = normal; C = low). Mean difference (bias): – -- – -- – -- –, low limit of agreement (–2 SD) and high limit of agreement (+ 2 SD): – - – - – - –. SBP high, normal, low: bias: 3.9, –4.6, –14.8 mmHg; limits of agreement: ± 14.6, ± 19.5, ± 10.3 mmHg; percentage of paired measurements lying within a difference between the two methods less than 10 mmHg: 69, 93, 100%; <20 mmHg: 100, 100, 100%. DBP high, normal, low: bias: 31.1, 20.7, 9.6 mmHg; limits of agreement: ± 27.6, ± 17.6, 14.4 mmHg; percentage of paired measurements lying within a difference between the two methods less than 10 mmHg: 14, 7, 100%; <20 mmHg: 14, 40, 80%

