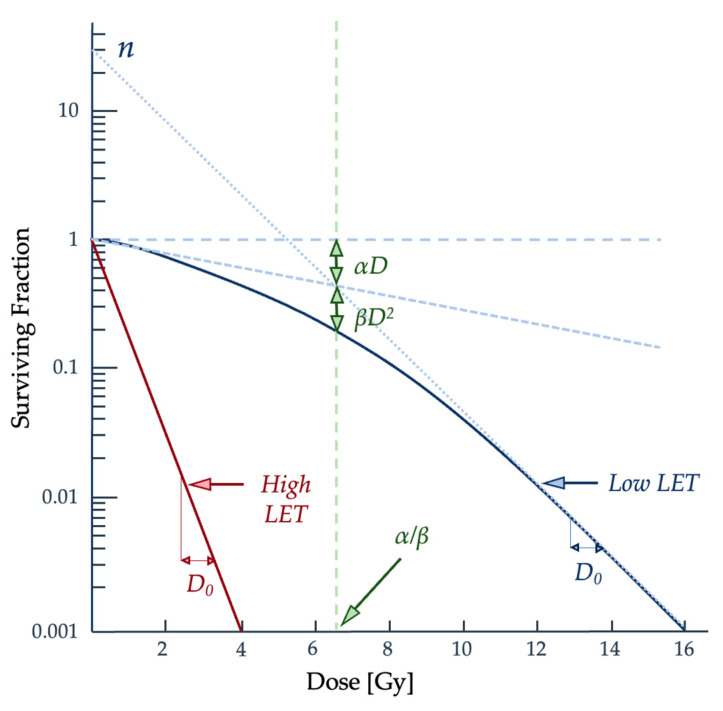
Figure 5.
The linearity of the curve on the logarithmic–linear scale represents an exponential relationship between the dose and the surviving fraction [12]. Densely ionizing radiation, or high LET particles such as α particles and neutrons, is the right-hand curve shown in red and is more likely to result in a linear curve. Sparsely ionizing radiation or low-LET particles such as x-rays will produce more of a shoulder to the curve, as described by Dq [2,12]. Figure adapted from Hall and Giaccia [2].

