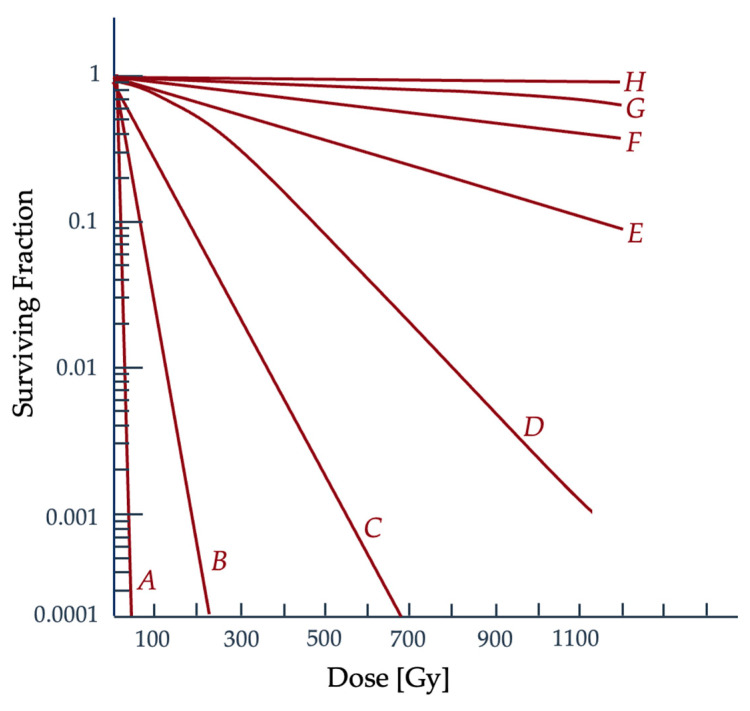
Figure 7.
Comparison of different types of cells and their response to ionizing radiation. Shown is a comparison of (A) a mammalian cell line radiation response curve with that of (B) E. coli, (C) E. coli B/r (a mutation of E. coli), (D) yeast, (E) phage staph E, (F) bacillus megaterium (G) potato virus, and (H) M. radiodurans (one of the most radioresistant known organisms) [2,49]. Figure adapted from Hall and Giaccia [2].

