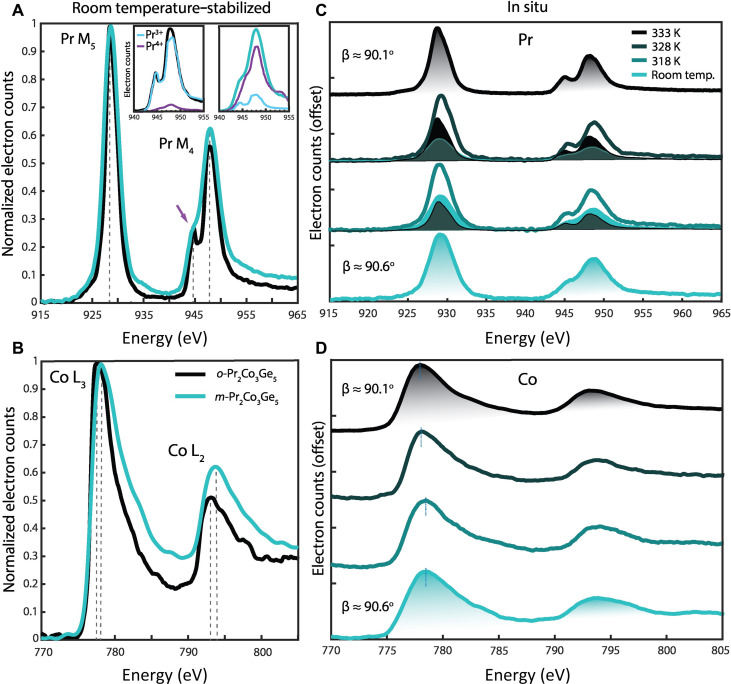
Fig. 2. Room-temperature and in situ EEL spectra of m-Pr2Co3Ge5 and o-Pr2Co3Ge5.
Core-loss EELS of the Pr M4,5 (A) and Co L2,3 edges (B) for room-temperature m-Pr2Co3Ge5 (blue) and o-Pr2Co3Ge5 (black). Dashed lines indicate the peak maxima, highlighting differences in the distribution of density of states between the two structures. Pr valency was determined by fitting reference M4,5 spectra for Pr3+ and Pr4+ (see Methods) to the acquired data, as shown in the inset of (A). The M4 edge feature at 945 eV (marked with an arrow) is a signature of Pr3+. This feature increases in prominence when the sample undergoes transformation. Temperature-dependent EEL spectra across the structural phase transformation are shown in (C and D). The Pr M4,5 edges correspond to 4f orbital occupancy and the Co L2,3 edges to 3d occupancy. The shading in (C) shows the linear fit contributions of the initial and final structures’ M4,5 edges to the spectra of the intermediate structures, indicating a gradual transition in Pr valency with structural transformation. The total integrated area of the spectra taken at room temperature and 333 K are shaded beneath their respective curves. Data were normalized on the basis of the M5 or L3 edge maxima.

