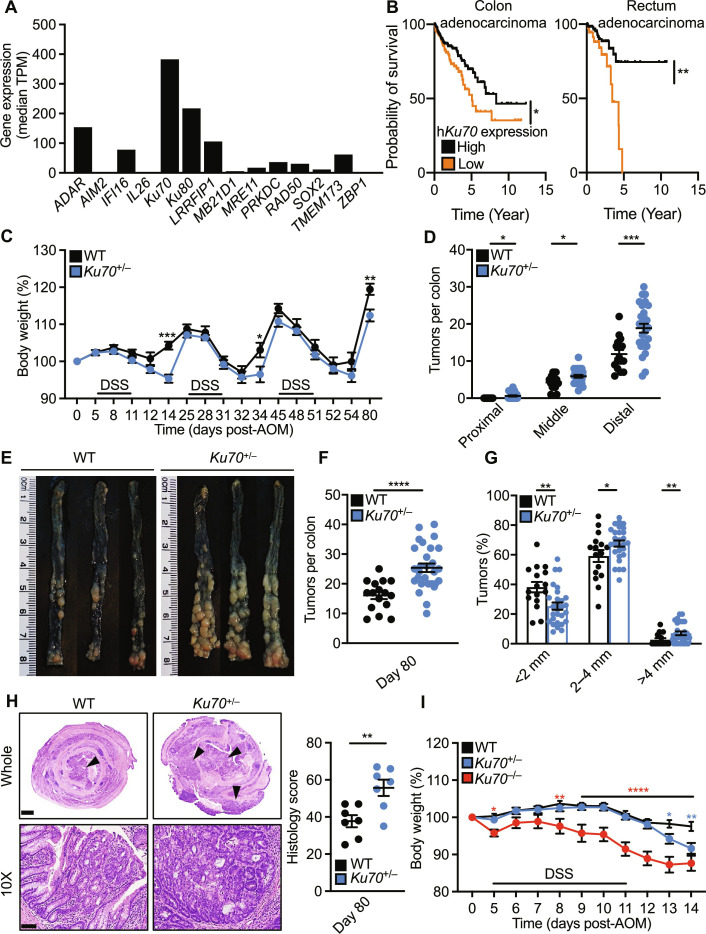
Fig. 1. Ku70 attenuates the development of colitis and colitis-associated colorectal cancer.
(A) The expression pattern of nucleic acid sensors in the colon tissue of healthy humans. Data are generated using the Genotype-Tissue Expression (GTEx) portal (114), and values are expressed as the median of transcripts per million (TPM). (B) Association between Ku70 expression and survival of patients with colon adenocarcinoma (left) and rectum adenocarcinoma (right). Data are generated using the Human Protein Atlas (115). (C) Percentage change in body weight of WT (n = 16) and Ku70+/− (n = 28) mice on the 129 genetic background during AOM-DSS treatment. (D) Number of tumors in the indicated parts of the colon of mice 80 days after AOM injection. (E) Representative images of colon tumors in mice 80 days after AOM injection. (F and G) Total number (F) and size (G) of tumors as shown in (E). (H) Hematoxylin and eosin (H&E) staining of the colon tissue of mice 80 days after AOM injection (left), quantified by total histological scores (right). Scale bars, 1 mm (top) and 100 μm (bottom). (I) Percentage change in body weight of littermate WT (n = 25), Ku70+/− (n = 20), and Ku70−/− (n = 15) mice on the 129 genetic background during AOM-DSS treatment. Each symbol [(D) and (F) to (H)] or image (E) represents an individual mouse. Arrowheads indicate dysplasia or adenoma (H). *P < 0.05; **P < 0.01; ***P < 0.001; ****P < 0.0001 by log-rank (Mantel-Cox) test (B), two-way analysis of variance (ANOVA) with Holm-Šídák’s multiple comparisons test [(C) and (I)], or unpaired t test [(D) and (F) to (H)]. Data are pooled from three independent experiments in (C), (D), (F), (G), and (I), and two experiments in (H) and are presented as mean ± SEM in (C), (D), and (F) to (I).

