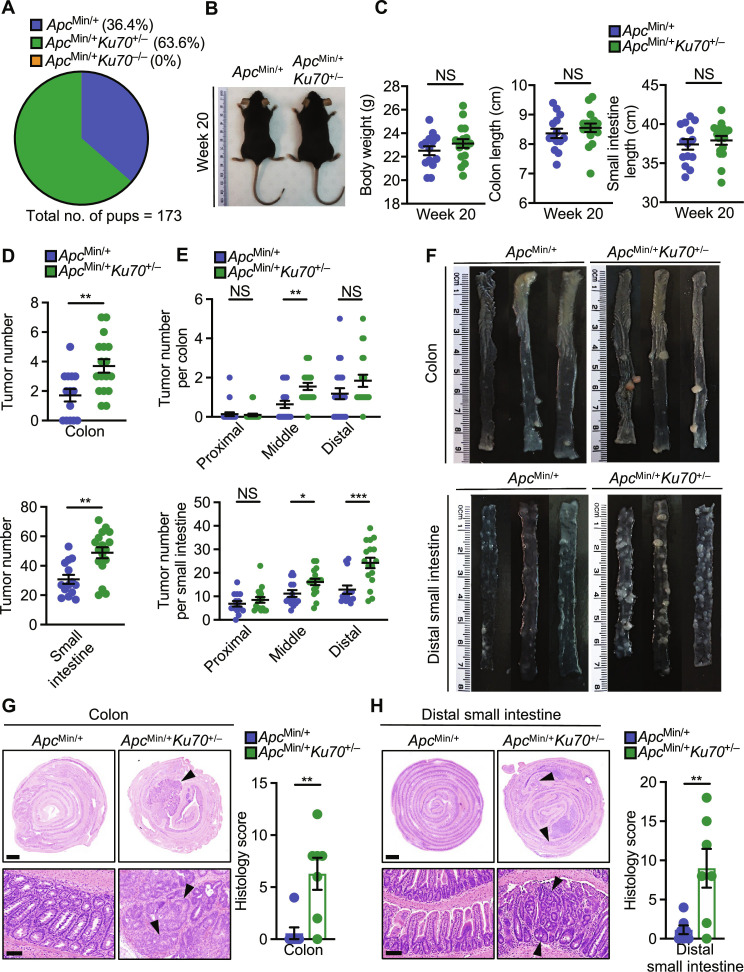
Fig. 2. Ku70 prevents the development of spontaneous intestinal cancer.
(A) Percentage of mice with the three indicated genotypes following the ApcMin/+ Ku70+/− × Apc+/+ Ku70+/− breeding scheme. (B) Representative image of littermate ApcMin/+ and ApcMin/+ Ku70+/− mice on the 129xC57BL/6N genetic background at 20 weeks of age. (C) Body weight (left), colon length (middle), and small intestine length (right) of ApcMin/+ and ApcMin/+ Ku70+/− mice at 20 weeks of age. (D to F) Tumor numbers in the whole colon (top) and whole small intestine (bottom) (D), tumor numbers in the indicated parts of the colon (top) and small intestine (bottom) (E), and representative images of the colon (top) and distal small intestinal (bottom) (F) of littermate ApcMin/+ and ApcMin/+Ku70+/− mice at 20 weeks of age. (G) H&E staining (left) and histological scores (right) in the colon tissue of littermate ApcMin/+ and ApcMin/+Ku70+/− mice at 20 weeks of age. Scale bars, 1 mm (top) and 100 μm (bottom). (H) H&E staining (left) and histological scores (right) in the distal small intestine tissue of littermate ApcMin/+ and ApcMin/+Ku70+/− mice at 20 weeks of age. Scale bars, 1 mm (top) and 100 μm (bottom). Each symbol represents an individual mouse [(C) to (E) and (G) and (H)]. Arrowheads indicate dysplasia or adenoma (G and H). NS, not statistically significant, *P < 0.05; **P < 0.01; ***P < 0.001; by unpaired t test [(C) to (E), (G), and (H)]. Data are presented as means ± SEM in (C) to (E), (G), and (H).

