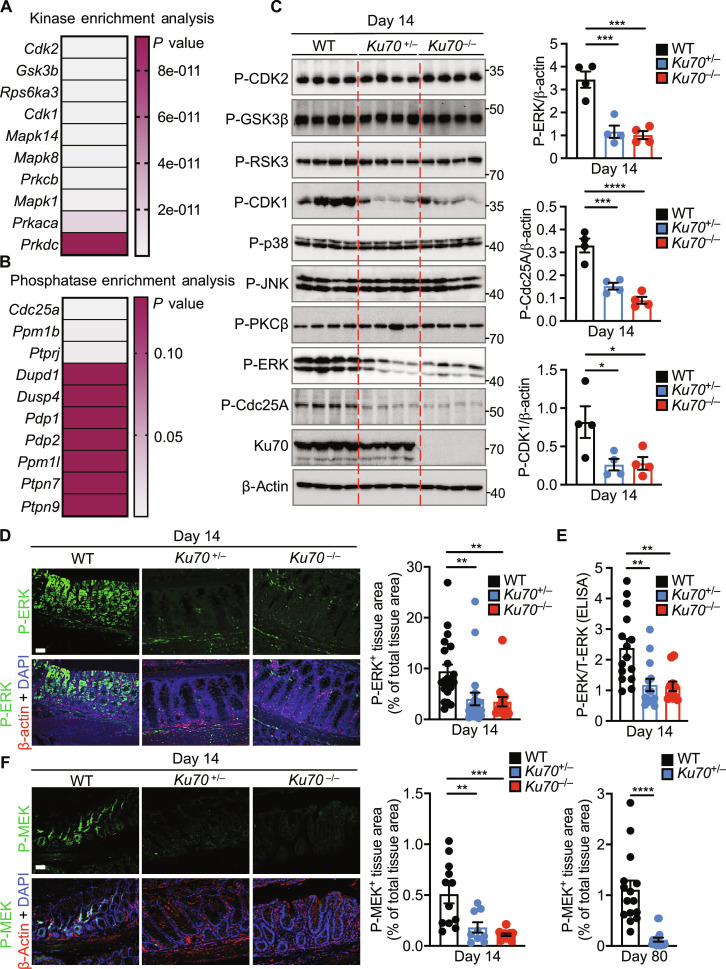
Fig. 4. Ku70 activates the ERK signaling pathway.
(A) Heatmap showing a list of genes encoding kinases filtered from a list of 509 differentially phosphorylated proteins obtained from the phospho-proteomic screen and analyzed using the Enrichr web server (37). (B) Heatmap showing a list of genes encoding phosphatases as analyzed in (A). (C) Immunoblot of the indicated proteins (left) and densitometric quantification (right) on the colon tissue lysate of littermate WT, Ku70+/−, and Ku70−/− mice. (D) Immunohistochemical staining of P-ERK, β-actin, and DAPI (left) and quantification of P-ERK–positive area over total tissue area (right) in the colon tissue of mice. Scale bar, 50 μm. (E) Ratio of P-ERK over T-ERK by ELISA on the colon tissue lysate of mice. (F) Immunohistochemical staining of P-MEK, β-actin, and DAPI (left) and quantification of P-MEK–positive area over total tissue area in the colon tissue of littermate WT, Ku70+/−, and Ku70−/− mice (middle) at day 14 and WT and Ku70+/− mice (right) at day 80. Scale bars, 50 μm. Each lane (C) or symbol [(C) and (E)] represents an individual mouse. Each symbol represents one of the three (proximal, middle, or distal) parts of the mouse colon in (D) and (F). P- indicates phosphorylated protein in (C) and (D) to (F). T- indicates total protein in (E). *P < 0.05; **P < 0.01; ***P < 0.001; ****P < 0.0001; by one-way ANOVA with Tukey’s multiple comparisons test [(C) to (E) and (F), left] or unpaired t test [(F), right]. Data are representative of [(C), (D), and (F)] or pooled from (E) three independent experiments and are presented as means ± SEM in (C) to (F).

