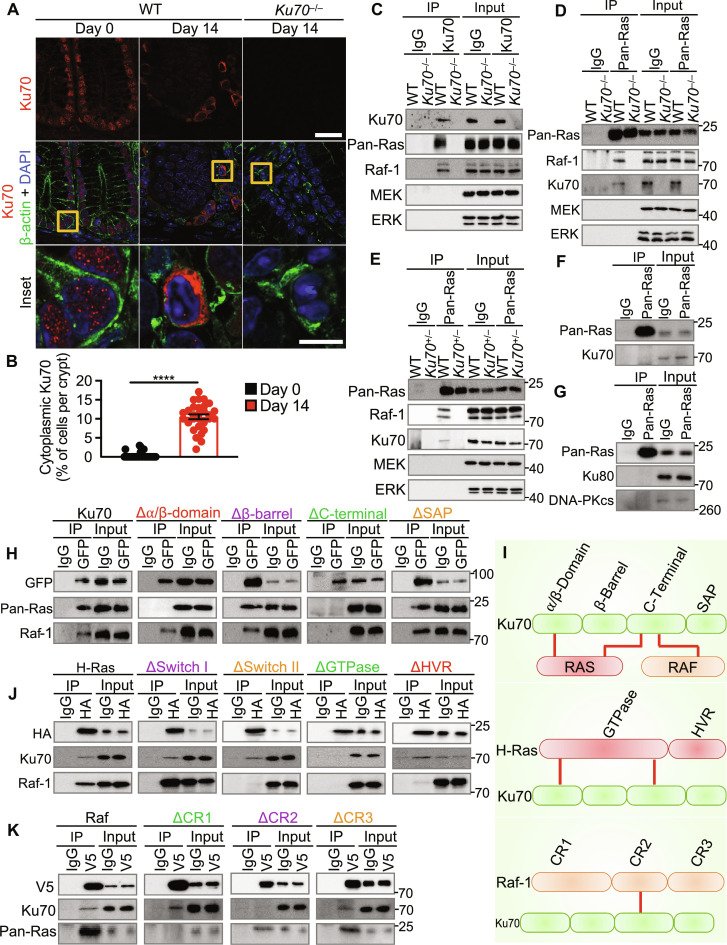
Fig. 5. Ku70 translocates from the nucleus to cytoplasm and interacts with the GTPase Ras and the kinase Raf.
(A and B) Immunohistochemical staining of Ku70, β-actin, and DAPI (A) and percentage of cells with cytoplasmic Ku70 (B) in the colon tissue of WT and Ku70−/− mice untreated (day 0) or treated with AOM-DSS (day 14). Scale bars, 20 μm (top) and 5 μm (inset). (C) Immunoprecipitation (IP) of control (IgG) or Ku70 from the colon tissue lysate of WT and Ku70−/− mice at day 14 and immunoblot of the indicated proteins. (D and E) IP of control (IgG) or pan-Ras from the colon tissue lysate of WT and Ku70−/− mice (D) or WT and Ku70+/− (E) mice at day 14 and immunoblot of indicated proteins. (F) IP of control (IgG) or Ras from the colon tissue lysate of untreated WT mice and immunoblot of the indicated proteins. (G) IP of control (IgG) or pan-Ras from the colon tissue lysate of WT mice at day 14 and immunoblot of the indicated proteins. (H) IP for control (IgG) or GFP-tagged Ku70 and immunoblot for the indicated proteins in HEK293T cells. (I) Model of Ku70-Ras-Raf interaction (top), Ku70-Ras interaction (middle), and Ku70–Raf-1 interaction (bottom). Red lines indicate interaction in (I). (J) IP for control (IgG) or HA-tagged H-Ras and immunoblot for the indicated proteins in HEK293T cells. (K) IP for control (IgG) or V5-tagged Raf and immunoblot for the indicated proteins in HEK293T cells. ****P < 0.0001; by unpaired t test (B). Data representative of three experiments in (A) to (K) and are presented as means ± SEM in (B).

