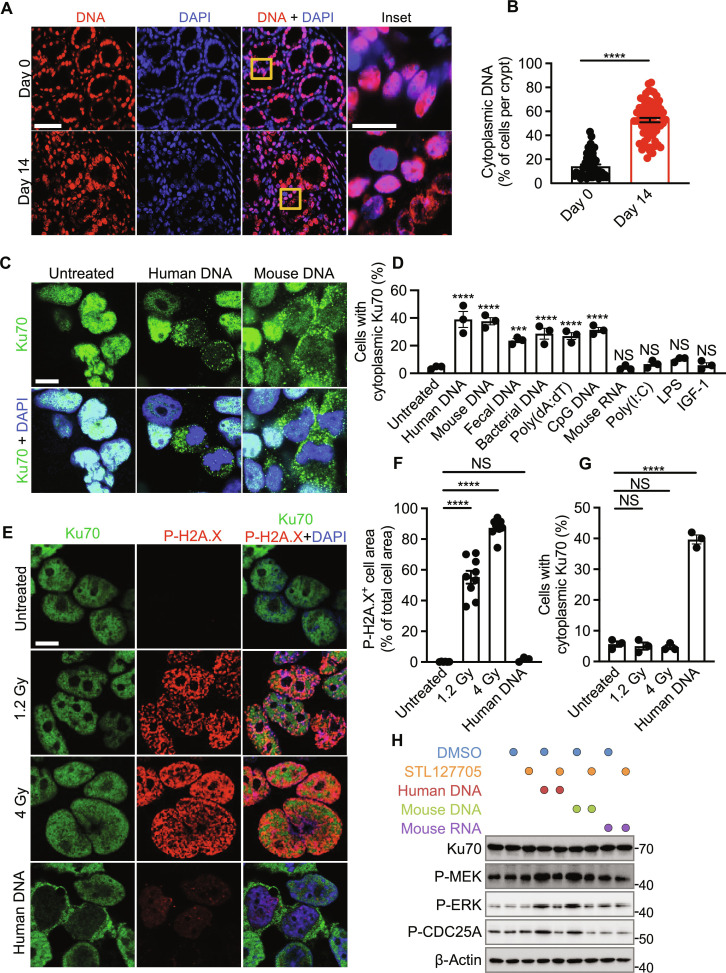
Fig. 6. Ku70 translocates from the nucleus and senses cytosolic DNA.
(A) Immunohistochemical staining of DNA and DAPI in the colon tissue of WT mice untreated (day 0) or treated with AOM-DSS (day 14). Scale bars, 20 μm (left) and 5 μm (inset). (B) Percentage of cells with cytoplasmic DNA in the colon tissue of WT mice as shown in (A). (C) Immunofluorescence staining of Ku70 and DAPI in HEK293T cells left nontransfected or transfected with human DNA (1 μg) and mouse colonic DNA (1 μg). Scale bar, 10 μm. (D) Percentage of cytoplasmic Ku70 in HEK293T cells left nontransfected or transfected for 6 hours with human DNA (1 μg), mouse colonic DNA (1 μg), mouse fecal DNA (1 μg), bacterial DNA (1 μg), poly(dA:dT) (1 μg), CpG DNA (1 μg), mouse colonic RNA (1 μg), and poly(I:C) (1 μg) or stimulated with LPS (1 μg) or IGF-1 (50 ng). (E to G) Immunofluorescence staining of Ku70, P-H2A.X, and DAPI (E), quantification of P-H2A.X–positive area over total cell area (F), and percentage of cytoplasmic Ku70 (G) in HEK293T cells left untreated or radiated with indicated doses or transfected with human DNA (1 μg). Scale bar, 10 μm. (H) Immunoblot of the indicated proteins on the cell lysate of HEK293T left untreated or pretreated with STL127705 (25 μM) for 1 hour. Cells were then left untreated or treated as indicated followed by incubation for 6 hours. DMSO was used to dissolve STL127705. NS, not statistically significant; ***P < 0.001; ****P < 0.0001; by unpaired t test (B) or one-way ANOVA with Tukey’s multiple comparisons test [(D), (F), and (G)]. Data representative of three mice in (A) and three experiments in (C), (D), and (H) or two experiments in (E) to (G). Data are presented as means ± SEM in (B), (D), (F), and (G).

