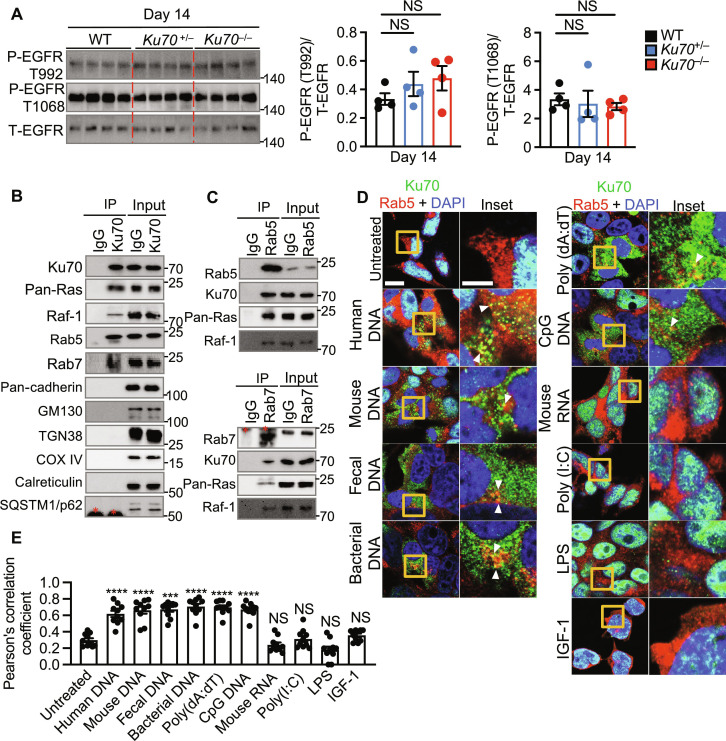
Fig. 7. Cytoplasmic translocation of Ku70 activates the Ras-ERK signaling at the endosome.
(A) Immunoblot of the indicated proteins (left) from the colon tissue lysate of littermate WT, Ku70+/−, and Ku70−/− mice and the corresponding densitometric quantification (right). (B) IP of control (IgG) or Ku70 from the colon tissue lysate of WT mice at day 14 after AOM injection and immunoblot of the indicated proteins. (C) IP of control (IgG) or Rab5 (top) and control (IgG) or Rab7 (bottom) from the colon tissue lysate of WT mice at day 14 after AOM injection and immunoblot of the indicated proteins. (D and E) Immunofluorescence staining of Ku70, Rab5, and DAPI (D) and frequency of colocalization between Ku70 and Rab5 (E) in HEK293T cells left nontransfected or transfected for 6 hours with human DNA (1 μg), mouse colonic DNA (1 μg), mouse fecal DNA (1 μg), bacterial DNA (1 μg), poly(dA:dT) (1 μg), CpG DNA (1 μg), mouse colonic RNA (1 μg), and poly(I:C) (1 μg) or stimulated with LPS (1 μg) or IGF-1 (50 ng). Scale bars, 10 μm (left) and 2.5 μm (inset). Each symbol represents an individual mouse (A) or cell in (D). P- indicates phosphorylated protein, and T- indicates total protein (A). *Indicates IgG bands in [(B) and (C)]. NS, not statistically significant; ***P < 0.001; ****P < 0.0001; by one-way ANOVA with Tukey’s multiple comparisons test [(A) and (D)]. Data representative of three experiments in (A), (D), and (E) or three mice in (B) and (C). Data are presented as mean ± SEM in (A) and (E).

