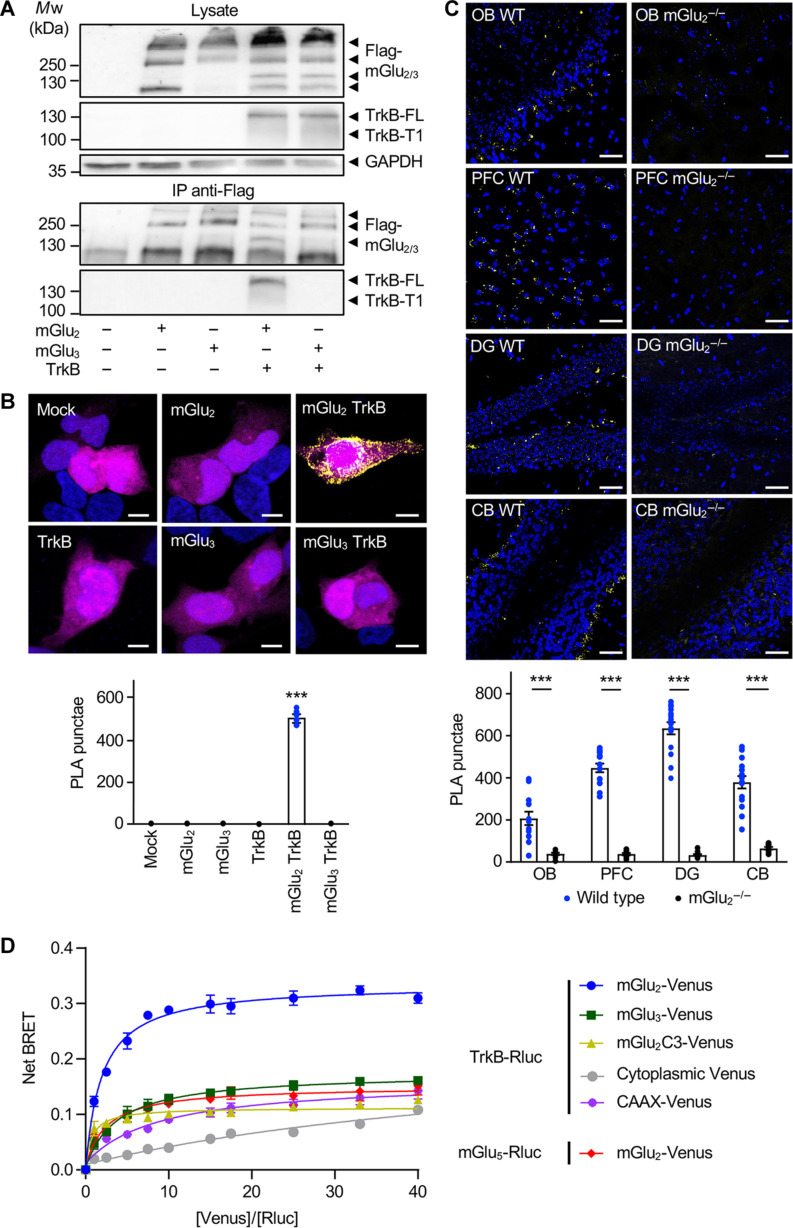
Fig. 2. TrkB interacts with mGlu2 but not with mGlu3.
(A) Western blots of anti-Flag immunoprecipitates obtained from HEK-293 cells expressing human Flag-tagged mGlu2 or mGlu3 in the absence or presence of human TrkB. Inputs (lysate) and anti-Flag immunoprecipitates (IP) were probed with anti-Flag antibody to detect mGlu2 and mGlu3, anti-TrkB antibody, and with anti-GAPDH antibody. The data are representative of four independent experiments performed on different cultures. (B) Representative images of PLA experiments performed with anti-Flag and anti-TrkB antibodies in HEK-293 cells expressing either human Flag-tagged mGlu2 or mGlu3 in the absence or presence of human TrkB. PLA signal is shown in yellow, cell nuclei are stained with 4′,6-diamidino-2-phenylindole (DAPI) in blue, and green fluorescent protein transfection control is shown in magenta. Scale bars, 5 μm. Data are representative of four independent experiments performed on different cultures. (C) Representative images of PLA experiments performed with the anti-mGlu2 nanobody and the anti-TrkB antibody on OB, PFC, DG, and CB slices from wild-type (WT) or mGlu2 KO (mGlu2−/−) mice. PLA signal is shown in yellow; cell nuclei are stained with DAPI in blue. Scale bars, 50 μm. The histogram shows means ± SEM of total PLA punctae per region of interest from 10 to 13 mice per condition. Two-way analysis of variance (ANOVA) (compared between wild type and mGlu2−/−, post hoc Šidák’s test): ***P < 0.001. (D) BRET saturation curves obtained from HEK-293 cells expressing a fixed amount of Rluc-TrkB or Rluc-mGlu5 and increasing amounts of Venus-mGlu2 or Venus-mGlu3 or Venus-mGlu2C3 (mGlu2 with mGlu3 C-terminal) or membrane bound CAAX-Venus or cytoplasmic Venus. Curves show means ± SEM of net BRET signals measured in three technical replicates of one experiment representative of four biological replicates. Two-way ANOVA (post hoc Šidák’s test): F8,26 = 638.6, ***P < 0.001.

