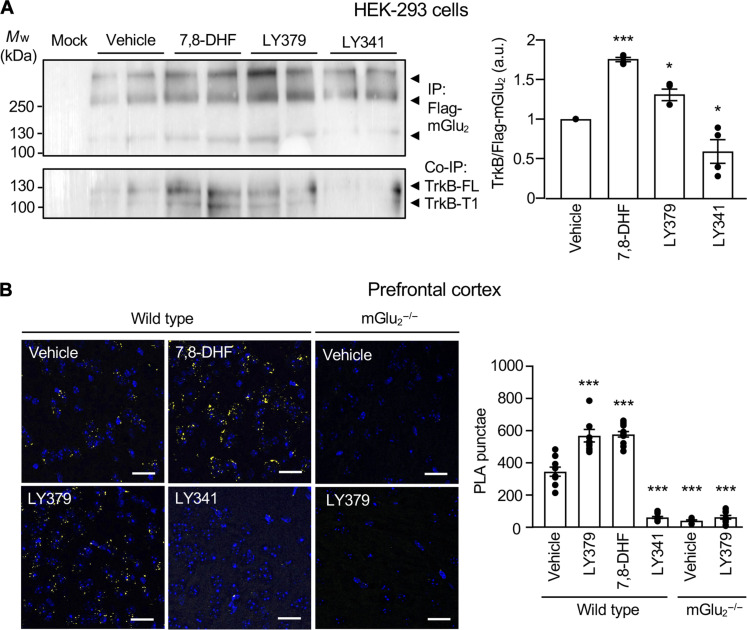
Fig. 3. mGlu2 and TrkB conformational states dynamically modulate mGlu2/TrkB interaction.
(A) Representative Western blot of anti-Flag immunoprecipitates performed from HEK-293 cells coexpressing human Flag-tagged mGlu2 and TrkB. Cells were treated for 15 min with either vehicle (Veh) or 7,8-DHF (1 μM) or LY379268 (1 μM; LY379) or LY341495 (3 μM; LY341). The histogram represents the means ± SEM of anti-TrkB immunoreactive signal normalized to anti-Flag immunoreactive signal [in arbitrary units (a.u.), n = 4]. One-way ANOVA (multiple comparisons compared to vehicle, post hoc Dunnett’s test): F3,16 = 1.264, *P < 0.05, and ***P < 0.001. (B) Representative images of PLA experiments performed with the anti-mGlu2 nanobody and the anti-TrkB antibody on PFC slices from wild-type or mGlu2−/− mice. Wild-type mice were injected with either vehicle or LY379268 (10 mg/kg; LY379) or 7,8-DHF (5 mg/kg) or LY341495 (3 mg/kg; LY341). mGlu2−/− mice were injected either with vehicle or LY379268. PLA signal is shown in yellow; cell nuclei are stained with DAPI (blue). Scale bars, 25 μm. Histograms represent the means ± SEM of the number of PLA punctae in PFC from 8 to 11 animals per condition. Two-way ANOVA (multiple comparisons compared to wild-type vehicle, post hoc Dunnett’s test): F5,49 = 130.9, *P < 0.05 and ***P < 0.001.

