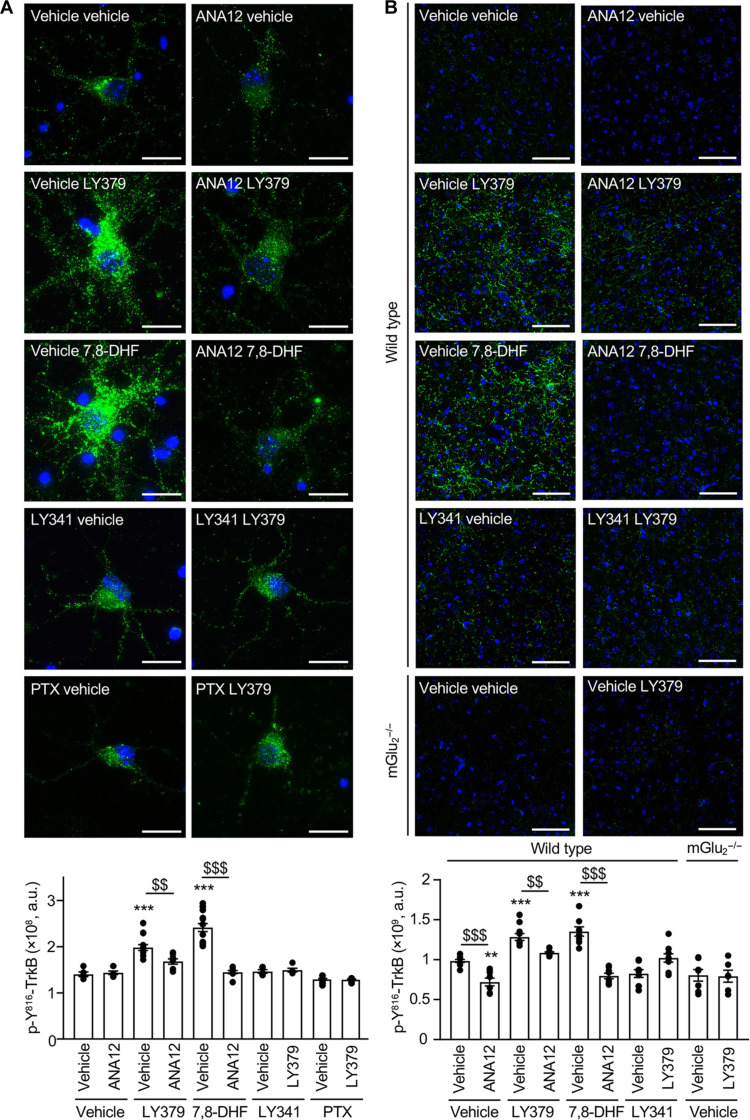
Fig. 4. mGlu2 stimulation transactivates TrkB.
(A) Representative images of p–Y816-TrkB immunolabeling (green) in four independent cultures of cortical neurons. Cells were pretreated with either vehicle or ANA-12 (10 μM) or LY341495 (10 μM; LY341) or PTX (0.2 μg/ml) and then challenged for 15 min with either vehicle or LY379268 (1 μM; LY379) or 7,8-DHF (1 μM). The histogram represents the means ± SEM of anti–p–Y816-TrkB immunoreactive signal (expressed as the number of positive pixels per field, n = 7). Scale bars, 20 μm. One-way ANOVA (compared to the associated vehicle pretreatment, post hoc Šidák’s test): F9,79 = 6.110, $$P < 0.005, and $$$P < 0.001. One-way ANOVA (multiple comparisons compared to vehicle vehicle, post hoc Dunnett’s test): F9,79 = 6.110, **P < 0.005, and ***P < 0.001. (B) Representative images of p–Y816-TrkB immunolabeling (green) in coronal PFC slices from 6 to 10 mice per condition. Wild-type mice were pretreated with either vehicle or ANA-12 (2.5 mg/kg) or LY341495 (3 mg/kg; LY341) and then injected with either vehicle or LY379268 (10 mg/kg; LY379) or 7,8-DHF (5 mg/kg). mGlu2−/− mice were injected with either vehicle or LY379268. The histogram represents the means ± SEM of anti–p–Y816-TrkB immunoreactive signal (expressed as the number of positive pixels per field) measured after the indicated treatments. Scale bars, 50 μm. One-way ANOVA compared to the associated vehicle pretreatment (post hoc Šidák’s test): F9,70 = 2.309, $$P < 0.005, and $$$P < 0.001. One-way ANOVA (multiple comparisons compared to vehicle vehicle, post hoc Dunnett’s test): F9,70 = 2.309, **P < 0.005, and ***P < 0.001.

