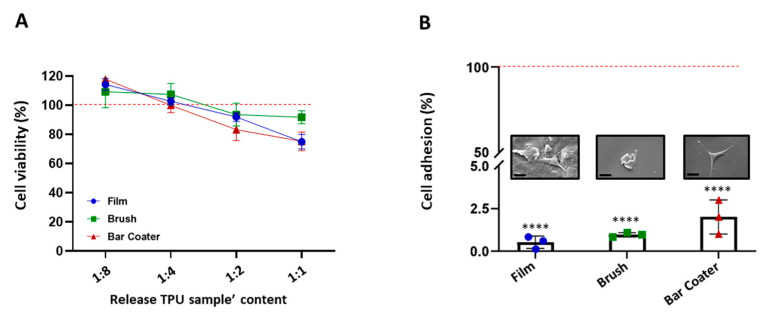
Figure 8.
Cell viability (A) and adhesion (B). NIH-3T3 cell medium was incubated with TPU samples overnight at 37 °C + 5% CO2. The released content of polymer from the samples was 2-fold diluted and incubated with NIH-3T3 cells for 24 h. The viability was evaluated through MTT colorimetric test (A). Data are shown as percentage of cell viability with respect to TCP control (red line) represented by cells grown in a well. Statistical analysis reported no significant differences (p > 0.05) with respect to TCP control and between samples. Cells were seeded on TPU samples for 24 h at 37 °C + 5% CO2 (B). The viability of adherent cells was evaluated through MTT. Data are shown as percentage of cell adhesion with respect to TCP control (red line). Data are represented as the mean values of the replicates (n = 3) ± the standard deviation (SD), denoted by the error bars. Statistics indicates the analysis vs. TCP: p < 0.0001 (****). ANOVA analysis was performed, and no significant differences (p > 0.05) were observed. SEM images of the cell adhesion on TPU surfaces were acquired at 3k× (scale bar 20 µm).

